-
Bug
-
Resolution: Done
-
 Normal
-
None
-
None
-
False
-
-
False
-
NEW
-
NEW
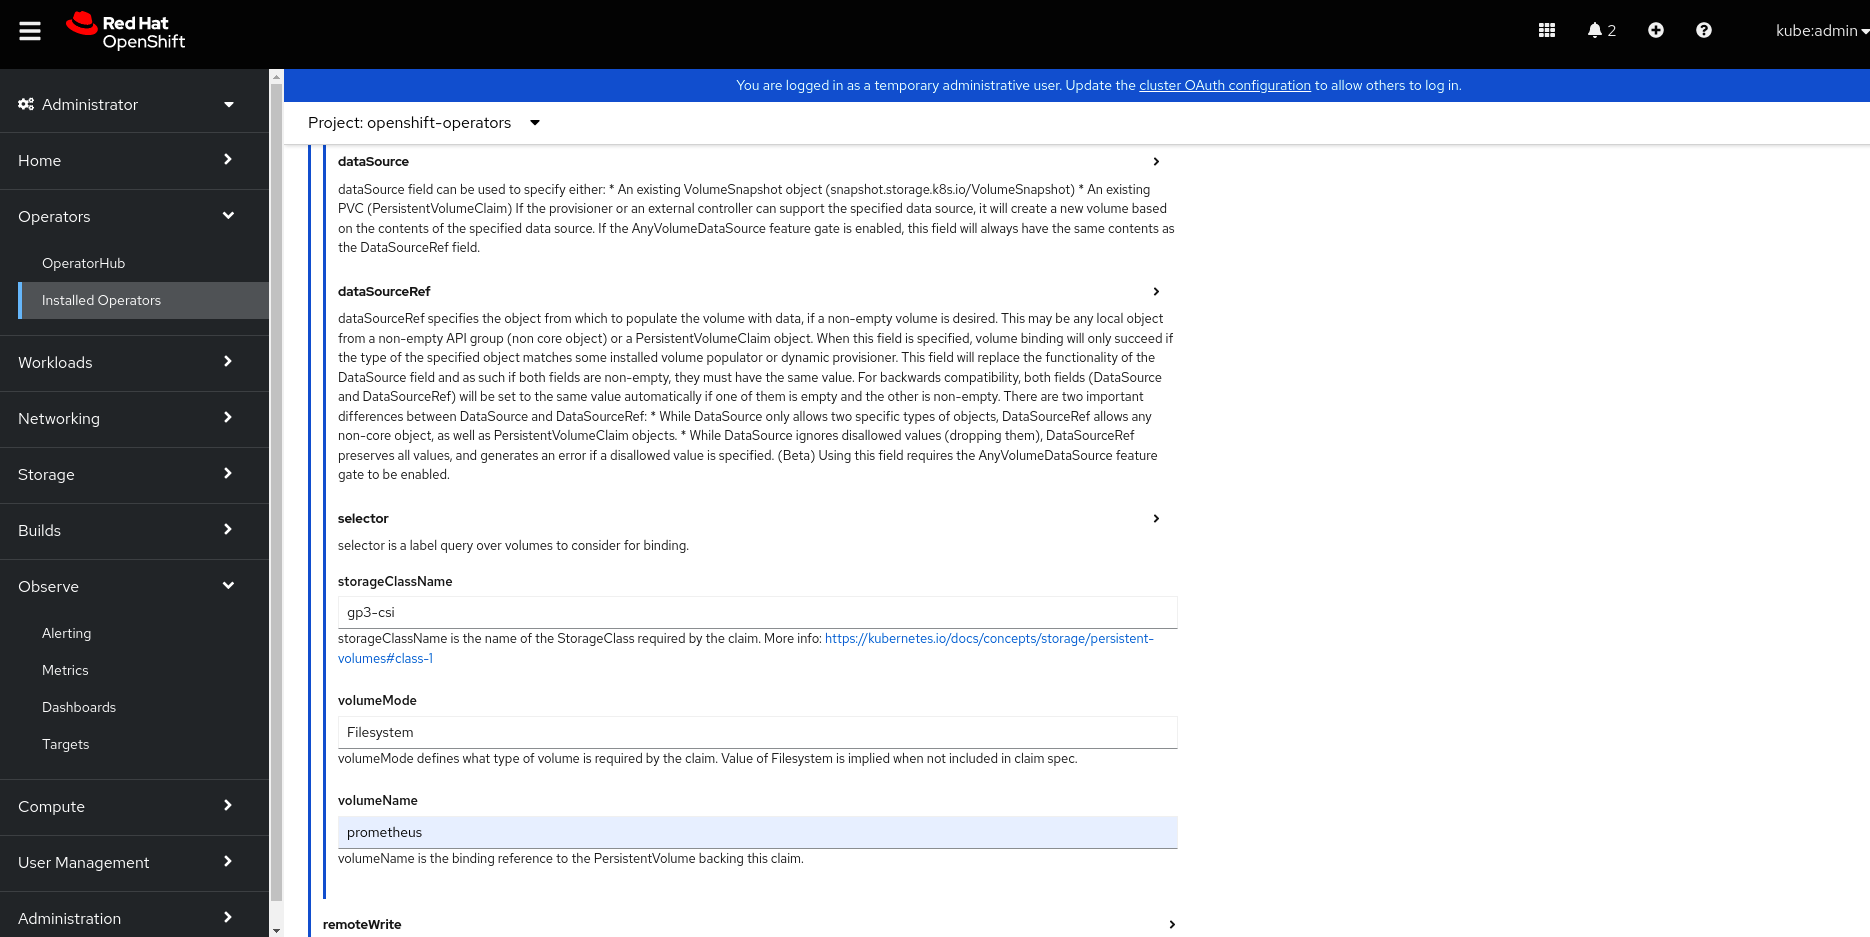
followed https://github.com/rhobs/observability-operator, and installed observability-operator 0.0.15 from console, then create MonitoringStack instance from console, prometheusConfig section, configure persistentVolumeClaim, set all parameters as below
storageClassName: gp3-csi
volumeMode: Filesystem
volumeName: prometheus
no prometheus pod created
$ oc -n openshift-operators get pod
NAME                                      READY   STATUS    RESTARTS        AGE
alertmanager-sample-monitoring-stack-0    2/2     Running   1 (5m41s ago)   5m44s
alertmanager-sample-monitoring-stack-1    2/2     Running   1 (5m41s ago)   5m44s
obo-prometheus-operator-d89987c4-nnlkd    1/1     Running   0               3h1m
observability-operator-6bb7b6fdfc-wzvbx   1/1     Running   0               3h1m
$ oc -n openshift-operators get sts
NAME                                   READY   AGE
alertmanager-sample-monitoring-stack   2/2     18s
prometheus-sample-monitoring-stack     0/2     18s

$ oc -n openshift-operators describe sts prometheus-sample-monitoring-stack
Name:               prometheus-sample-monitoring-stack
Namespace:          openshift-operators
CreationTimestamp:  Fri, 14 Oct 2022 16:48:51 +0800
Selector:           app.kubernetes.io/instance=sample-monitoring-stack,app.kubernetes.io/managed-by=prometheus-operator,app.kubernetes.io/name=prometheus,operator.prometheus.io/name=sample-monitoring-stack,operator.prometheus.io/shard=0,prometheus=sample-monitoring-stack
Labels:             app.kubernetes.io/managed-by=observability-operator
                    app.kubernetes.io/name=sample-monitoring-stack
                    app.kubernetes.io/part-of=sample-monitoring-stack
                    operator.prometheus.io/name=sample-monitoring-stack
                    operator.prometheus.io/shard=0
Annotations:        prometheus-operator-input-hash: 8788989730615523757
Replicas:           2 desired | 0 total
Update Strategy:    RollingUpdate
Pods Status:        0 Running / 0 Waiting / 0 Succeeded / 0 Failed
Pod Template:
  Labels:           app.kubernetes.io/component=prometheus
                    app.kubernetes.io/instance=sample-monitoring-stack
                    app.kubernetes.io/managed-by=prometheus-operator
                    app.kubernetes.io/name=prometheus
                    app.kubernetes.io/part-of=sample-monitoring-stack
                    app.kubernetes.io/version=2.39.0
                    operator.prometheus.io/name=sample-monitoring-stack
                    operator.prometheus.io/shard=0
                    prometheus=sample-monitoring-stack
  Annotations:      kubectl.kubernetes.io/default-container: prometheus
  Service Account:  sample-monitoring-stack-prometheus
  Init Containers:
   init-config-reloader:
    Image:      quay.io/rhobs/obo-prometheus-config-reloader:v0.60.0-rhobs1
    Port:       8080/TCP
    Host Port:  0/TCP
    Command:
      /bin/prometheus-config-reloader
    Args:
      --watch-interval=0
      --listen-address=:8080
      --config-file=/etc/prometheus/config/prometheus.yaml.gz
      --config-envsubst-file=/etc/prometheus/config_out/prometheus.env.yaml
      --watched-dir=/etc/prometheus/rules/prometheus-sample-monitoring-stack-rulefiles-0
      --log-level=debug
    Limits:
      cpu:     100m
      memory:  50Mi
    Requests:
      cpu:     100m
      memory:  50Mi
    Environment:
      POD_NAME:   (v1:metadata.name)
      SHARD:     0
    Mounts:
      /etc/prometheus/config from config (rw)
      /etc/prometheus/config_out from config-out (rw)
      /etc/prometheus/rules/prometheus-sample-monitoring-stack-rulefiles-0 from prometheus-sample-monitoring-stack-rulefiles-0 (rw)
  Containers:
   prometheus:
    Image:      quay.io/prometheus/prometheus
    Port:       9090/TCP
    Host Port:  0/TCP
    Args:
      --web.console.templates=/etc/prometheus/consoles
      --web.console.libraries=/etc/prometheus/console_libraries
      --storage.tsdb.retention.time=1d
      --config.file=/etc/prometheus/config_out/prometheus.env.yaml
      --storage.tsdb.path=/prometheus
      --web.enable-lifecycle
      --web.route-prefix=/
      --log.level=debug
      --web.config.file=/etc/prometheus/web_config/web-config.yaml
    Limits:
      cpu:     500m
      memory:  512M
    Requests:
      cpu:        100m
      memory:     256M
    Liveness:     http-get http://:web/-/healthy delay=0s timeout=3s period=5s #success=1 #failure=6
    Readiness:    http-get http://:web/-/ready delay=0s timeout=3s period=5s #success=1 #failure=3
    Startup:      http-get http://:web/-/ready delay=0s timeout=3s period=15s #success=1 #failure=60
    Environment:  <none>
    Mounts:
      /etc/prometheus/certs from tls-assets (ro)
      /etc/prometheus/config_out from config-out (ro)
      /etc/prometheus/rules/prometheus-sample-monitoring-stack-rulefiles-0 from prometheus-sample-monitoring-stack-rulefiles-0 (rw)
      /etc/prometheus/web_config/web-config.yaml from web-config (ro,path="web-config.yaml")
      /prometheus from prometheus-sample-monitoring-stack-db (rw,path="prometheus-db")
   config-reloader:
    Image:      quay.io/rhobs/obo-prometheus-config-reloader:v0.60.0-rhobs1
    Port:       8080/TCP
    Host Port:  0/TCP
    Command:
      /bin/prometheus-config-reloader
    Args:
      --listen-address=:8080
      --reload-url=http://localhost:9090/-/reload
      --config-file=/etc/prometheus/config/prometheus.yaml.gz
      --config-envsubst-file=/etc/prometheus/config_out/prometheus.env.yaml
      --watched-dir=/etc/prometheus/rules/prometheus-sample-monitoring-stack-rulefiles-0
      --log-level=debug
    Limits:
      cpu:     100m
      memory:  50Mi
    Requests:
      cpu:     100m
      memory:  50Mi
    Environment:
      POD_NAME:   (v1:metadata.name)
      SHARD:     0
    Mounts:
      /etc/prometheus/config from config (rw)
      /etc/prometheus/config_out from config-out (rw)
      /etc/prometheus/rules/prometheus-sample-monitoring-stack-rulefiles-0 from prometheus-sample-monitoring-stack-rulefiles-0 (rw)
   thanos-sidecar:
    Image:       quay.io/thanos/thanos:v0.24.0
    Ports:       10902/TCP, 10901/TCP
    Host Ports:  0/TCP, 0/TCP
    Args:
      sidecar
      --prometheus.url=http://localhost:9090/
      --prometheus.http-client={"tls_config": {"insecure_skip_verify":true}}
      --grpc-address=:10901
      --http-address=:10902
      --log.level=debug
    Environment:  <none>
    Mounts:       <none>
  Volumes:
   config:
    Type:        Secret (a volume populated by a Secret)
    SecretName:  prometheus-sample-monitoring-stack
    Optional:    false
   tls-assets:
    Type:                Projected (a volume that contains injected data from multiple sources)
    SecretName:          prometheus-sample-monitoring-stack-tls-assets-0
    SecretOptionalName:  <nil>
   config-out:
    Type:       EmptyDir (a temporary directory that shares a pod's lifetime)
    Medium:
    SizeLimit:  <unset>
   prometheus-sample-monitoring-stack-rulefiles-0:
    Type:      ConfigMap (a volume populated by a ConfigMap)
    Name:      prometheus-sample-monitoring-stack-rulefiles-0
    Optional:  false
   web-config:
    Type:        Secret (a volume populated by a Secret)
    SecretName:  prometheus-sample-monitoring-stack-web-config
    Optional:    false
Volume Claims:
  Name:          prometheus-sample-monitoring-stack-db
  StorageClass:  gp3-csi
  Labels:        <none>
  Annotations:   <none>
  Capacity:      <default>
  Access Modes:  [ReadWriteOnce]
Events:
  Type     Reason        Age                 From                    Message
  ----     ------        ----                ----                    -------
  Warning  FailedCreate  21s (x12 over 31s)  statefulset-controller  create Pod prometheus-sample-monitoring-stack-0 in StatefulSet prometheus-sample-monitoring-stack failed error: failed to create PVC prometheus-sample-monitoring-stack-db-prometheus-sample-monitoring-stack-0: PersistentVolumeClaim "prometheus-sample-monitoring-stack-db-prometheus-sample-monitoring-stack-0" is invalid: spec.resources[storage]: Required value
  Warning  FailedCreate  11s (x13 over 31s)  statefulset-controller  create Claim prometheus-sample-monitoring-stack-db-prometheus-sample-monitoring-stack-0 for Pod prometheus-sample-monitoring-stack-0 in StatefulSet prometheus-sample-monitoring-stack failed error: PersistentVolumeClaim "prometheus-sample-monitoring-stack-db-prometheus-sample-monitoring-stack-0" is invalid: spec.resources[storage]: Required value
Version-Release number of selected component (if applicable):
observability-operator 0.0.15
How reproducible:
always
Steps to Reproduce:
1. see the description
2.
3.
Actual results:
no prometheus pod is created, describe pod, info is:
  Warning  FailedCreate  21s (x12 over 31s)  statefulset-controller  create Pod prometheus-sample-monitoring-stack-0 in StatefulSet prometheus-sample-monitoring-stack failed error: failed to create PVC prometheus-sample-monitoring-stack-db-prometheus-sample-monitoring-stack-0: PersistentVolumeClaim "prometheus-sample-monitoring-stack-db-prometheus-sample-monitoring-stack-0" is invalid: spec.resources[storage]: Required value
Expected results:
should see the pod