-
Epic
-
Resolution: Unresolved
-
 Major
Major
-
None
-
None
-
[UI] Visualize partition log size
-
False
-
-
False
-
To Do
-
MGDSRVS-170 - Improve Monitoring, Metrics and Observability capabilities to support Production Workloads
-
67% To Do, 0% In Progress, 33% Done
Problem Statement
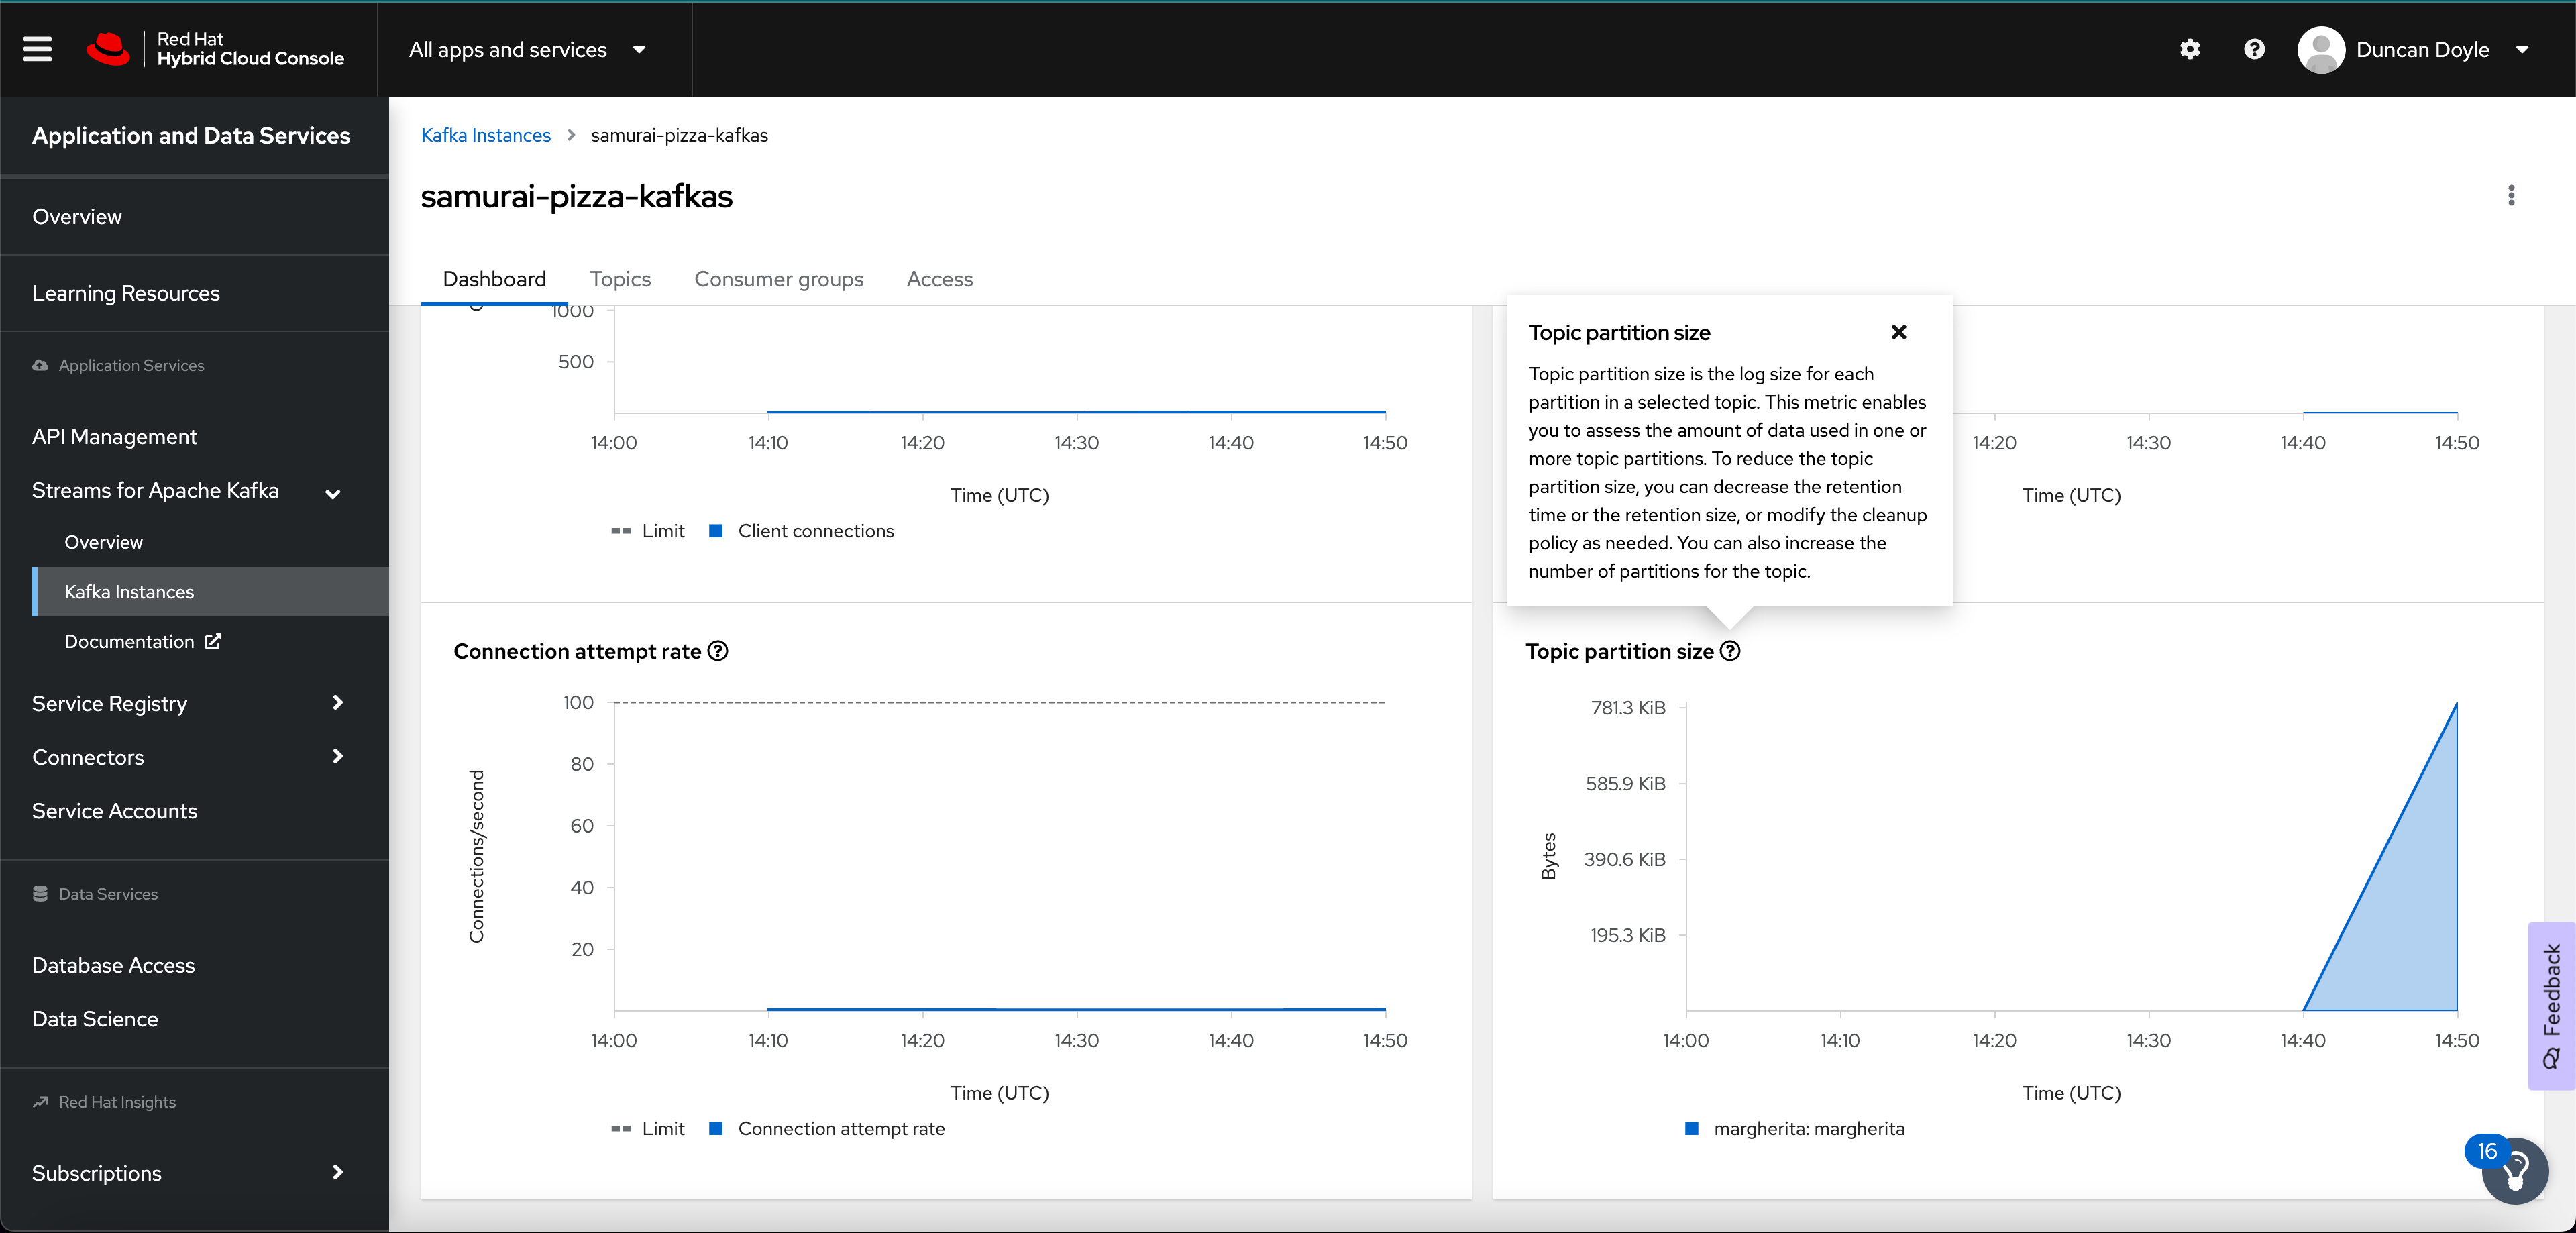
Our current "Topic Partition Size" graph in our Dashboard UI shows the sum of the sizes of all partitions of a given topic. I.e. when you have a topic with 10 partitions, the graph shows the sum of partition sizes of these 10 partitions.
This model works OK from a storage management perspective in a 1 SU model, with a default replication factor of 3, as each partition would be present on all 3 brokers (1 leader, 2 followers). However, in this scenario you would still not be able to identify which partitions of your topic contain the most data, and whether your partitioning strategy is effectively spreading the data, and thus the load across all partitions to optimally benefit from parallel message processing (i.e. if all your events are sent to a 1 partition of your 10 partition topic, only 1 consumer per consumer-group will process this data, and hence you will effectively not have any parallel processing of your events).
In a 2 Streaming Unit OpenShift Streams instance, this also creates potential problems wrt storage, as not all data is guaranteed to be evenly spread across all brokers. Having insights in which partitions contain the most data and occupy the most storage is very useful in situations where potential problems and challenges arise due to uneven distribution of data across partitions (see also MGDX-190).
The new partition size metrics introduced in MGDSTRM-8891 allow us to drill down into the size of the individual partitions of a given topic, providing users better insight in the behaviour of their OpenShift Streams instances, allows them to better utilize the instance resources (in particular storage) and optimize their partition strategy for better performance and throughput.
Narrative
Shaun is an Ops engineer at FoodRacers online meal delivery services. FoodRacers has been happily using OpenShift Streams in production for the last couple of months. With the growing popularity of their delivery service, they have been outgrowing their 1 Streaming Unit OpenShift Streams instance. In collaboration with Red Hat Services, they've decided to move to a larger Kafka cluster, and have deployed a 2 Streaming Unit OpenShift Streams instance.
At some point during what seems to be normal operations and business as usual, message production to OpenShift Streams instance seems to slow down, and message rates drop below expected rates. Shaun knows about the OpenShift Streams service limits, and suspects the problem is due to Kafka producers being throttled as the brokers are running out of storage space. Shaun opens the Dashboard in the OpenShift Streams Dashboard UI in the Red Hat Hybrid Cloud Console. He checks the Used Storage Graph and sees that the used storage size of his OpenShift Streams instance is still far below the limit. Instead of the total user storage, he now checks the graph that shows the storage limits and used storage per broker. He can clearly see that broker 4 is clearly approaching its storage limit.
Shaun quickly analysis the partition distribution across the brokers and sees that 3 of largest partitions are all assigned to broker 4. He decides to reassign these partitions to other brokers to solve the immediate problem. The next day he has a meeting with the full DevOps team to discuss the long term solution to this problem. It is decided that increasing the number of partitions on the given topics, combined with a better partitioning strategy should solve the problem.
Proposed Solution
The proposed solution is to display, apart from the total size of a topic, the sizes of the individual partitions of a given topic. There are a number of ways we can do this
- Replace the current information in the "Topic Partition Size" graph with size information per partition. This would mean no longer showing the total topic size information, i.e. the sum of the size of all partitions of a given topic.
- Add a selection menu, filter or tab in the current "Topic Partition Size" graph that would allow the user to drill down from the total topic size to the size of the individual partitions of a given topic. Having a filter would allow the user to select only the partitions they would be interested in, which might make it easier for the user to properly analyse the situation, especially for topics that have lots of partitions (10s or even 100s).
- Add an additional panel to the dashboard next to the existing "Topic Size" panel that would display the "Partition Size" per partition of the given topic.. Also in this case, being able to filter out certain partitions can be useful, especially when topics consist of a lot of partitions.
Apart from being able to see the sizes of the individual partitions of a given topic, it should also be possible to show the sizes of all partitions (across topics) that are assigned to a given broker, and thus contribute to the storage usage of that broker.
Acceptance Criteria
- The user is able to view the size of the individual partitions of a given topic in the Dashboard UI of OpenShift Streams for Apache Kafka.
- The user is able to filter the partitions in this view, allowing to only view the information of the partition's they are interested in them to help them to better analyse the problem.
- The UI provides information about which brokers the partitions are assigned to (leaders and followers) to allow the users to understand which partitions are assigned to which broker
- The user is able to view all the partitions (across topics) assigned to a given broker. This allows the user to clearly analyse which partitions of which topics contribute to the storage usage of the given broker.

- is blocked by
-
-

- Closed
-
- is related to
-
-
- Closed
-

