-
Bug
-
Resolution: Done
-
 Critical
-
None
-
None
-
None
-
None
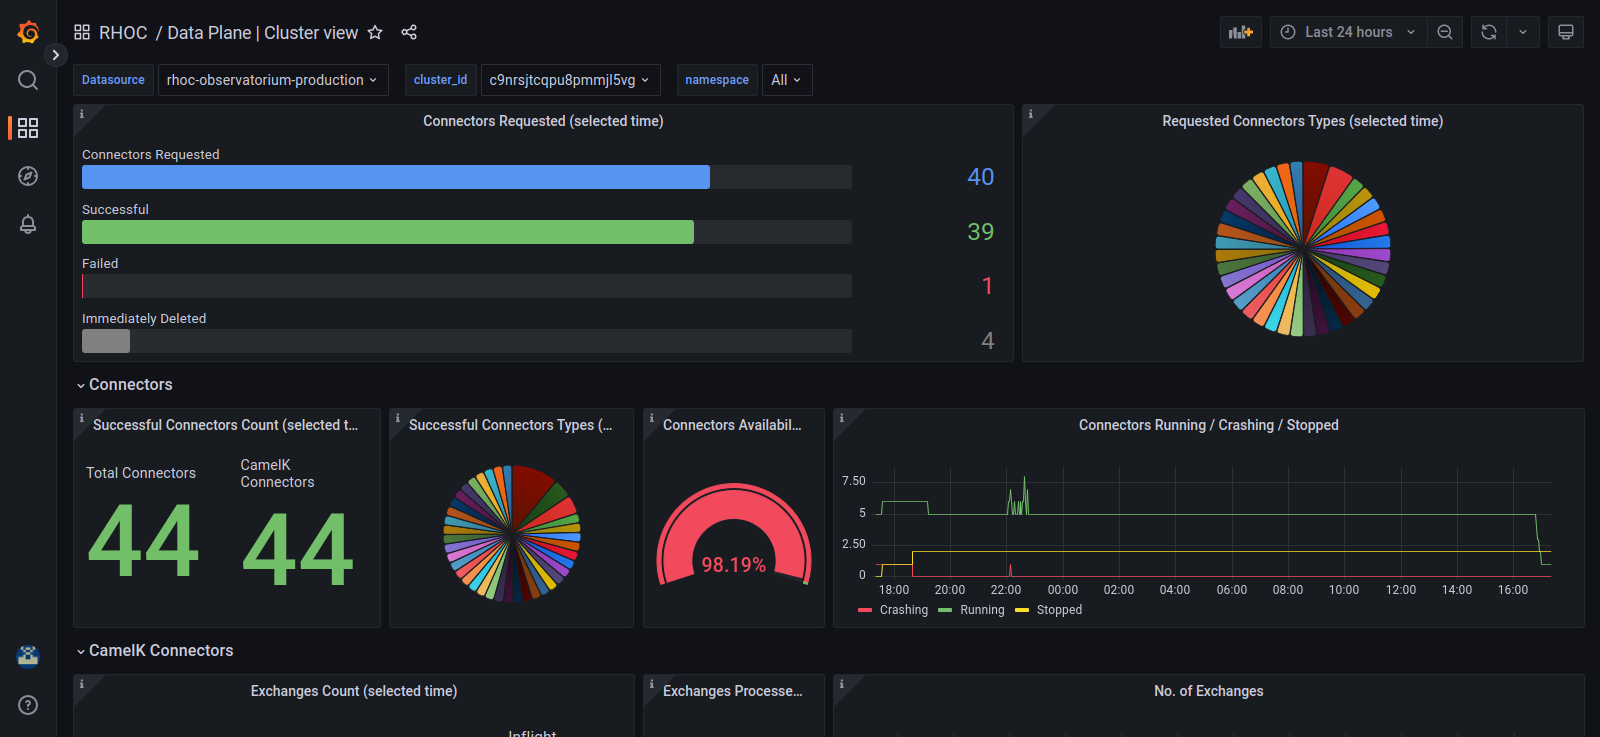
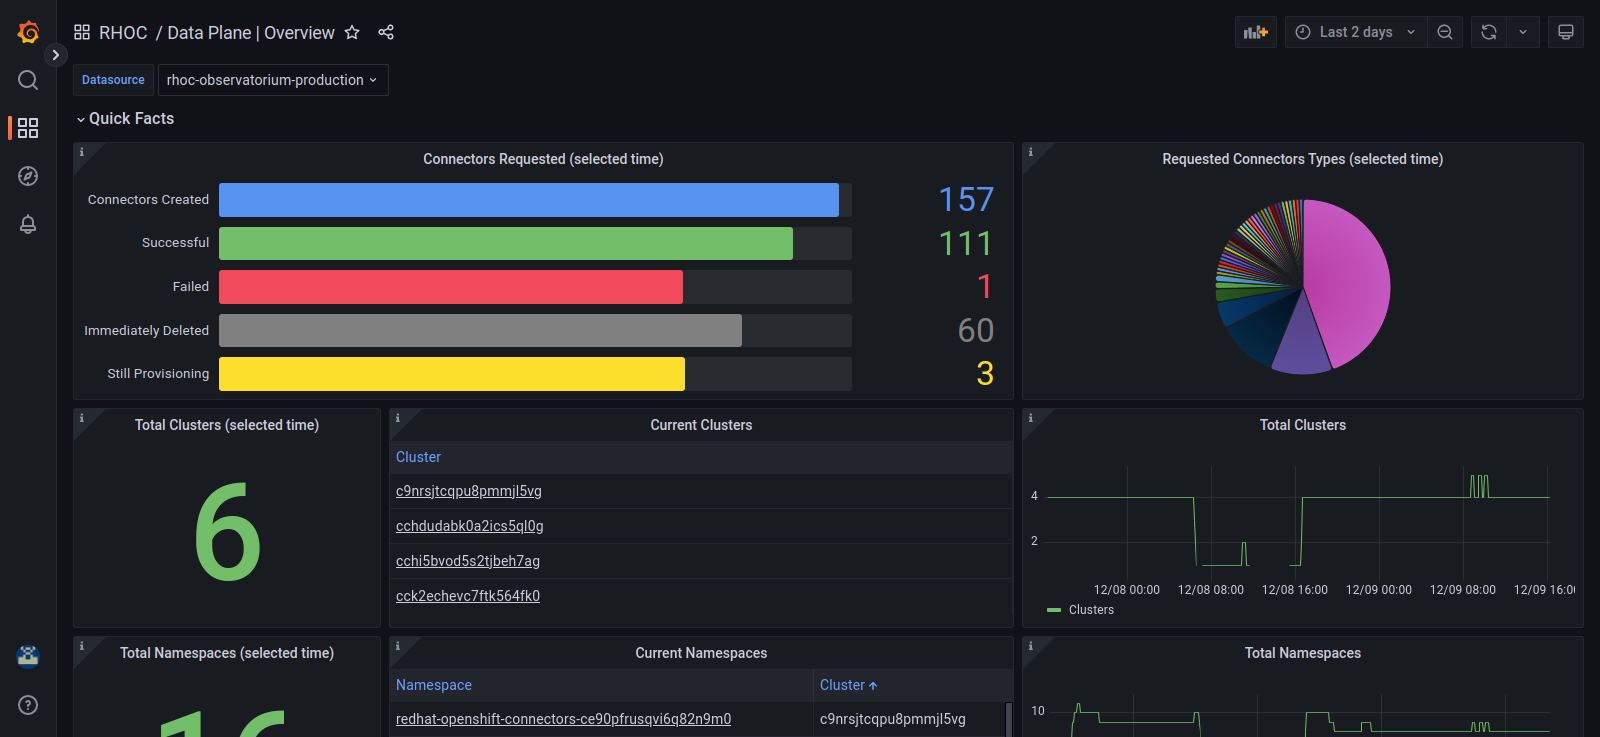
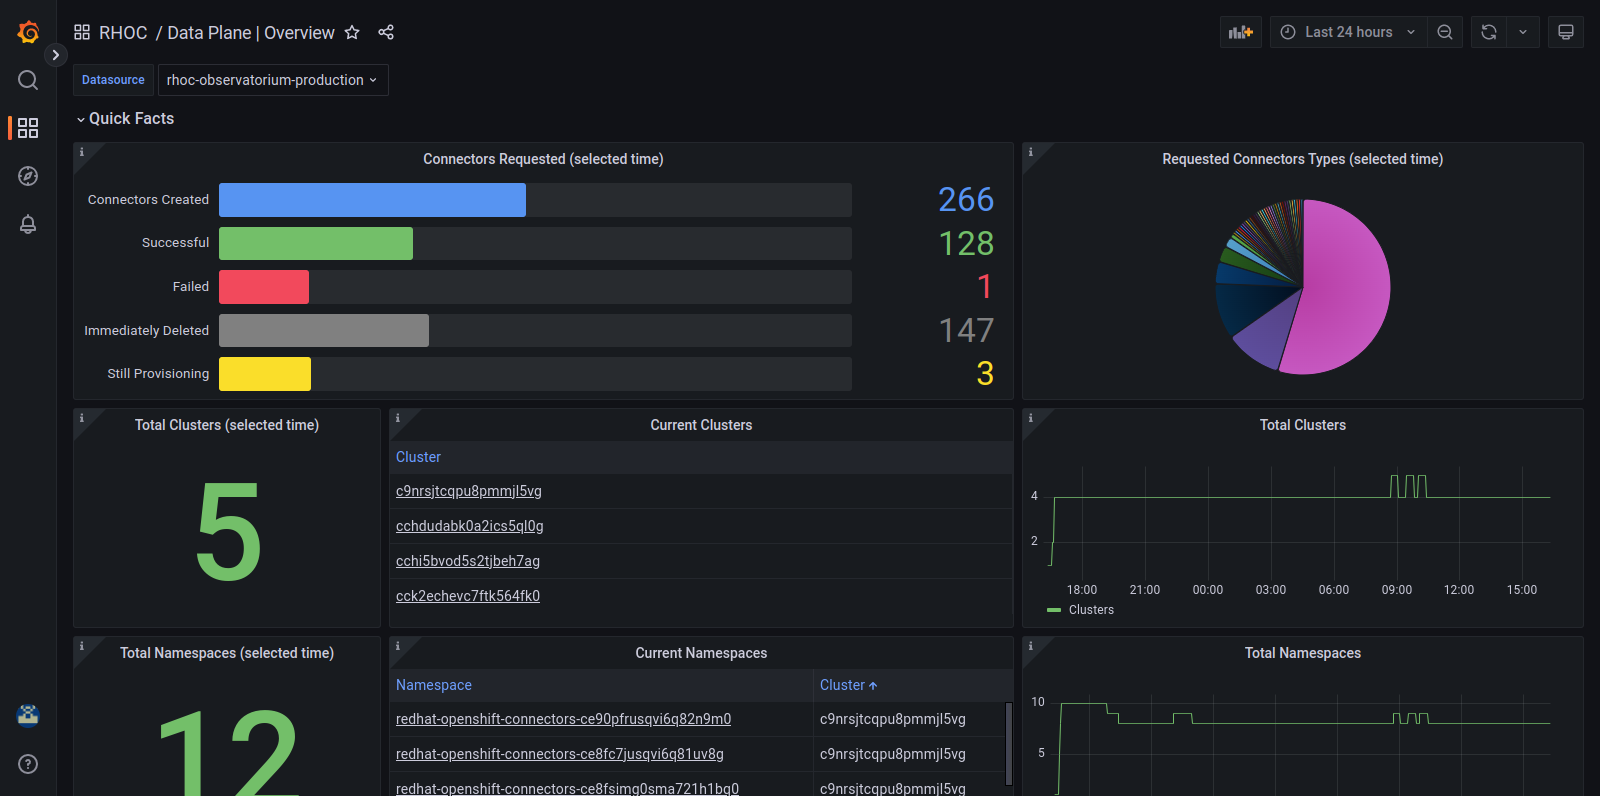
Issues with "Connectors Requested (selected time)" panel in both "Data Plane | Overview" and "Data Plane | Cluster view" dashboards:
- shorter timeframe showing more connectors than larger timeframe
- number of Connectors Requested not equal to the sum of the other statuses
- failed connector showing up in shorter timeframe but not in larger timeframe