-
Spike
-
Resolution: Done
-
 Major
Major
-
None
-
None
-
None
-
None
-
5
-
False
-
-
False
-
Yes
-
-
-
RHOAM Sprint 45
Why
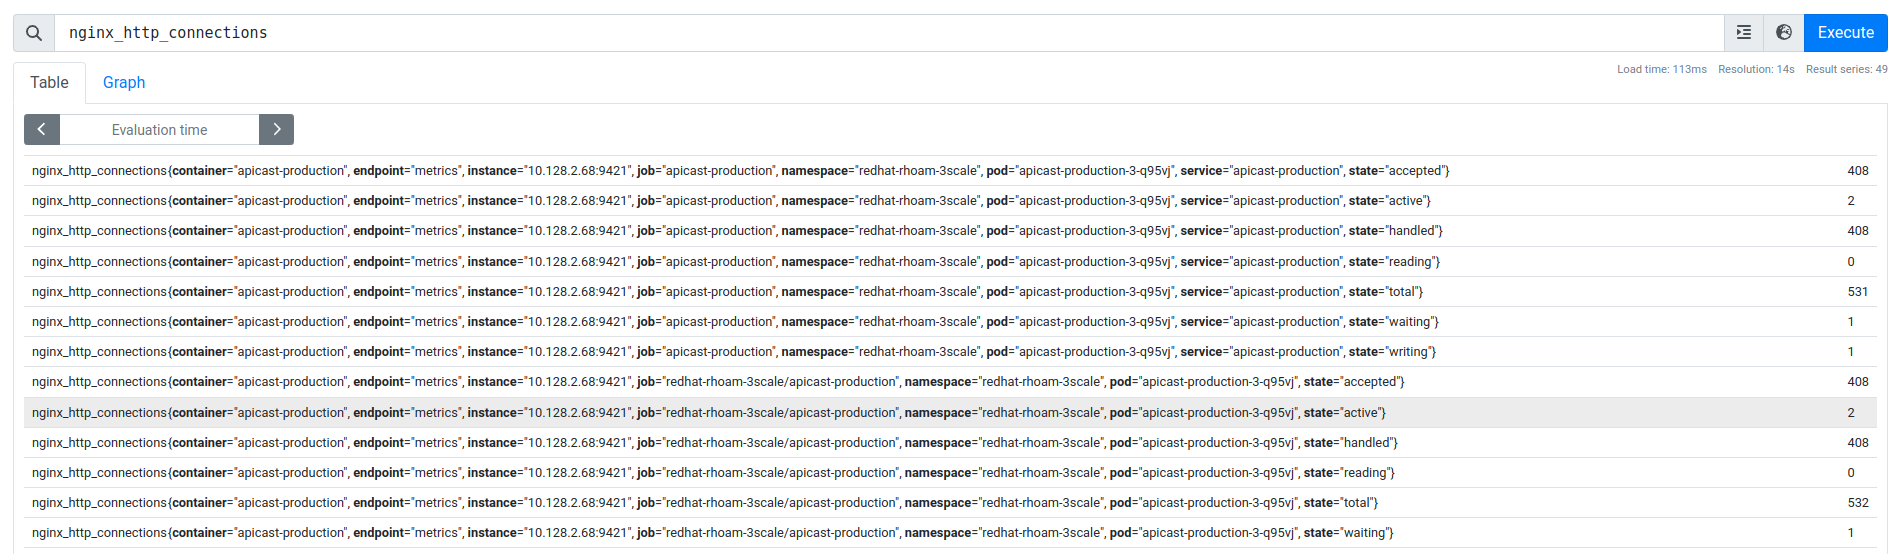
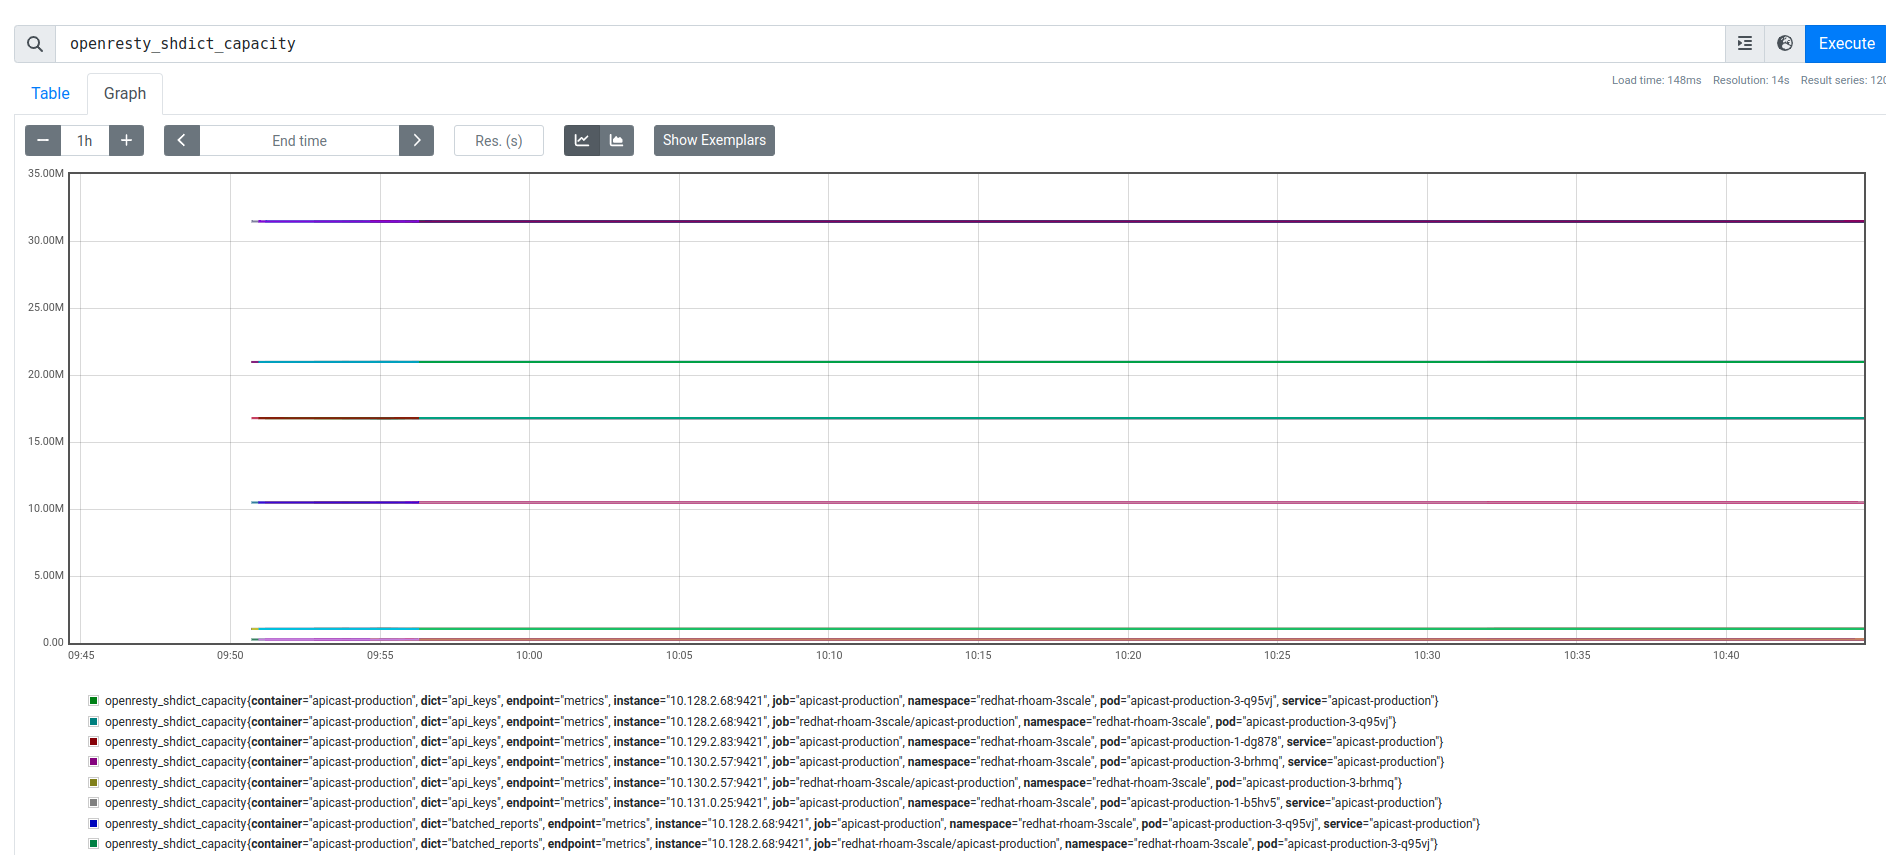
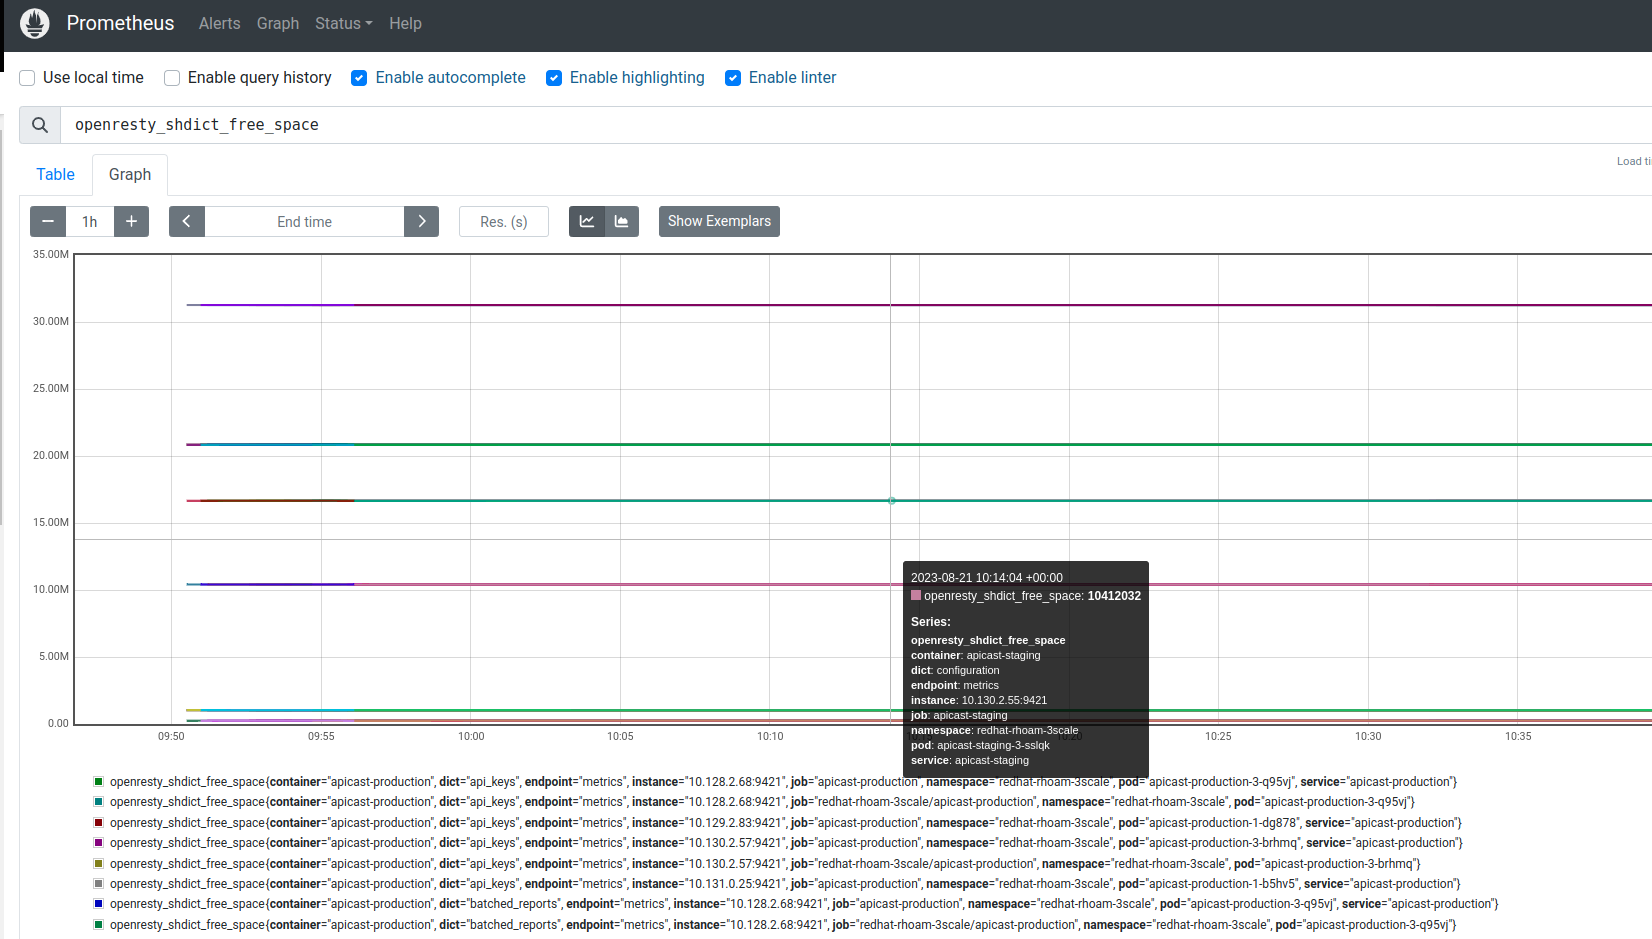
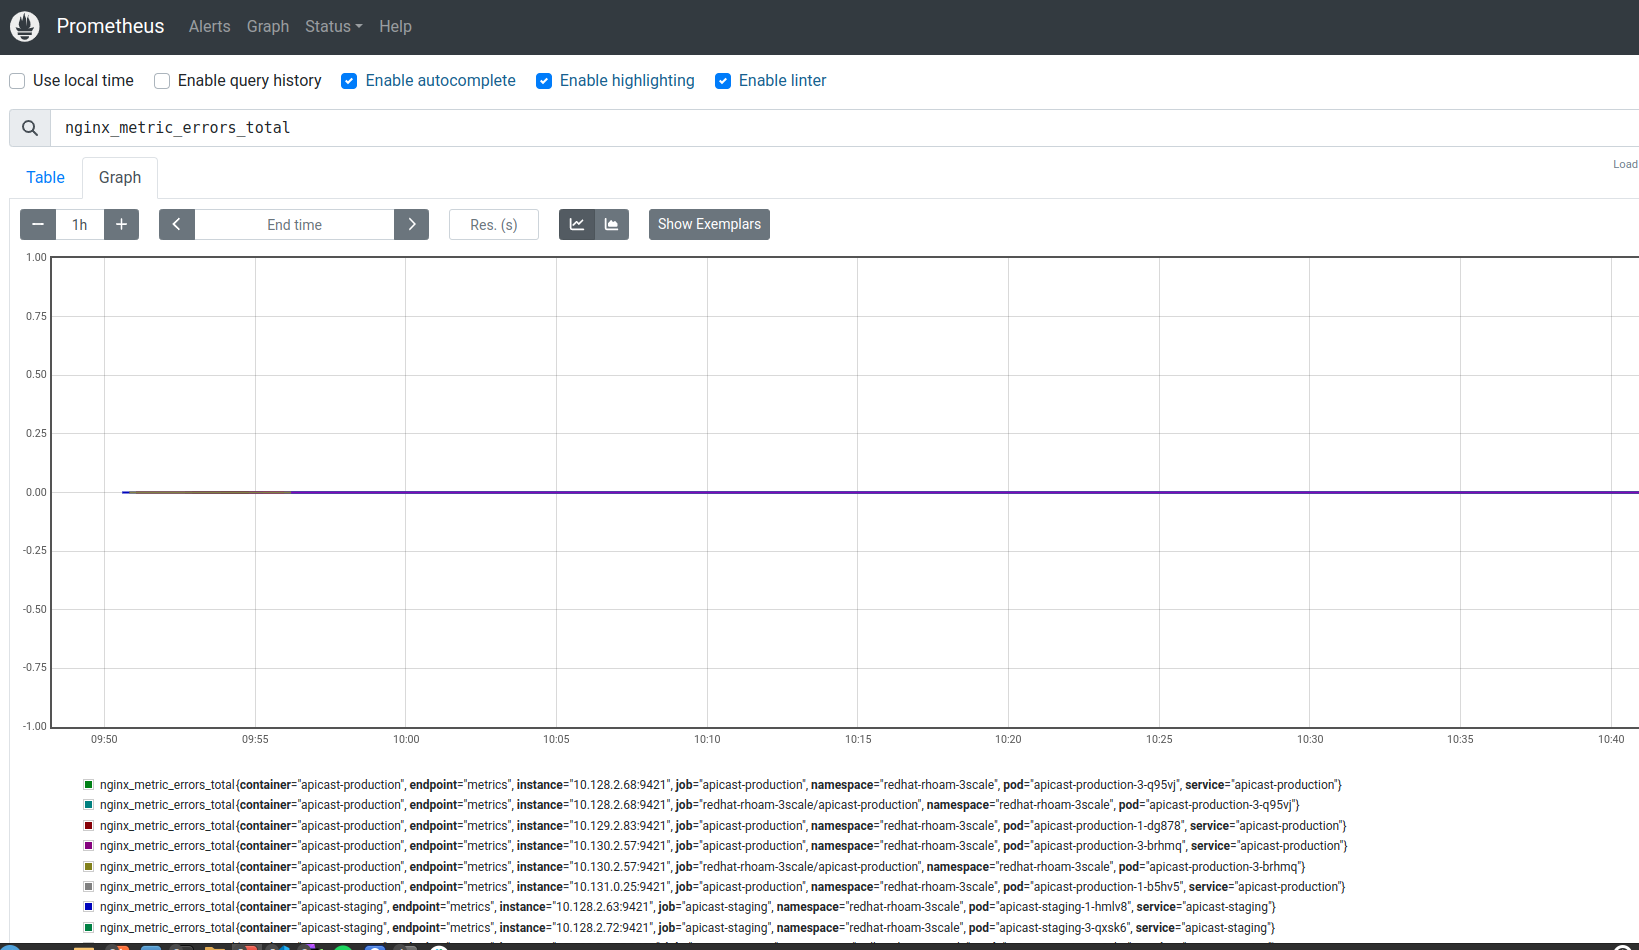
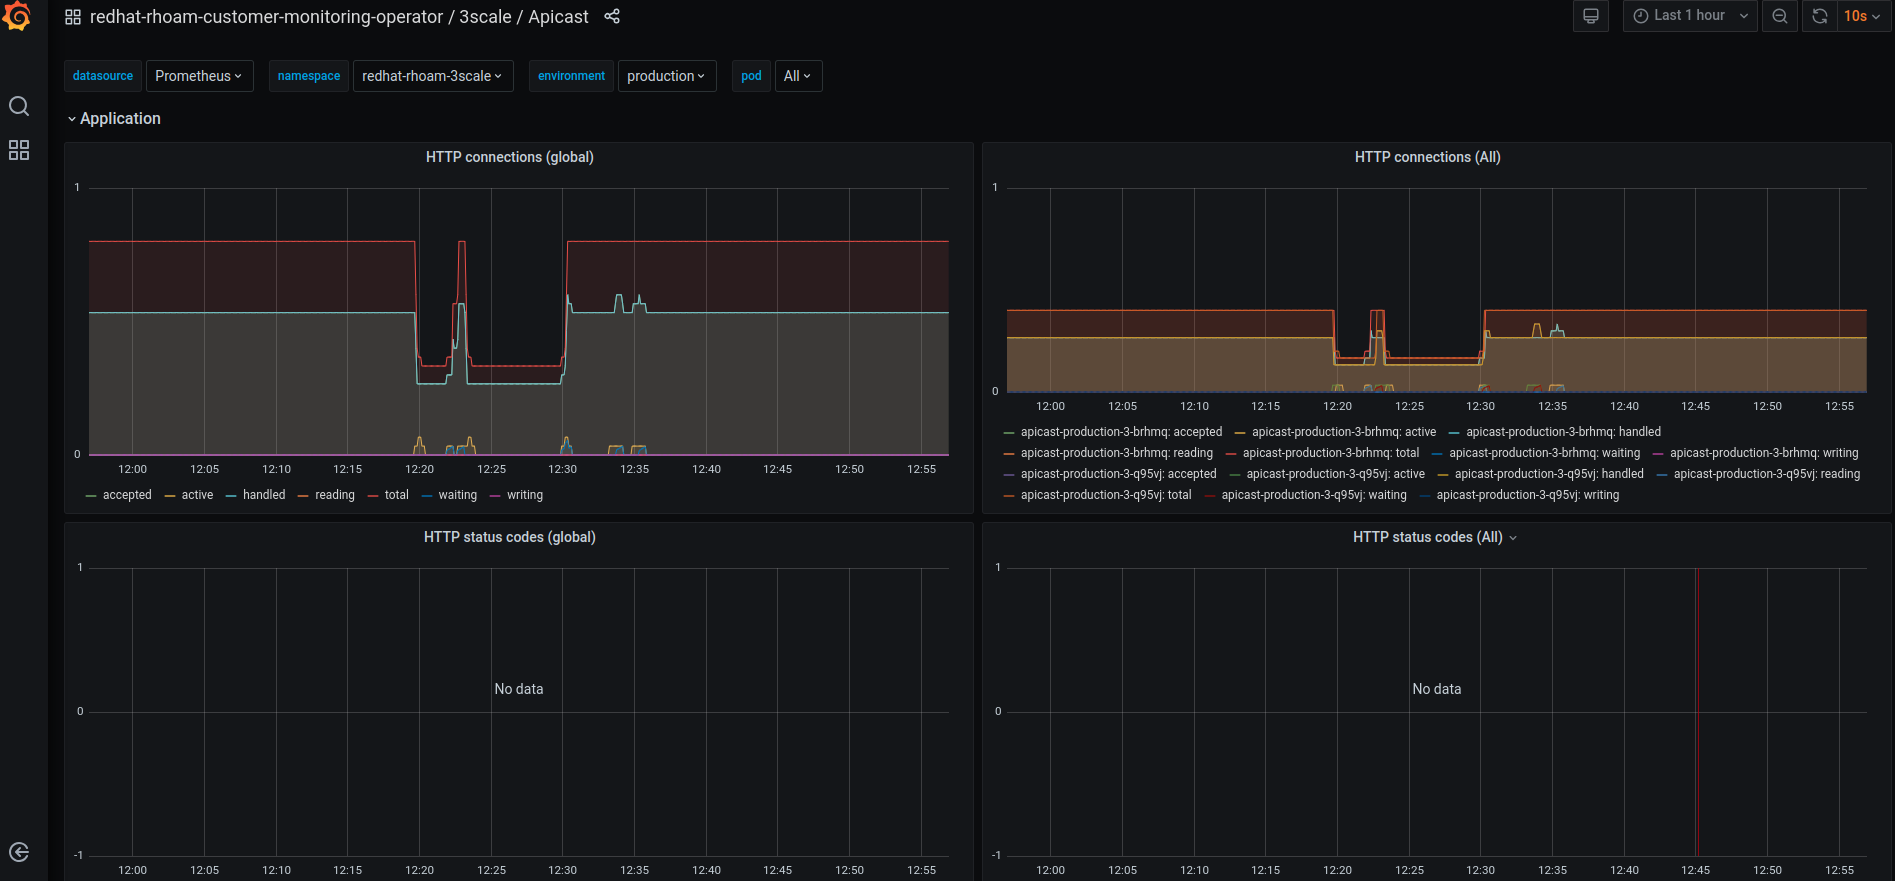
To help with investigating 3scale traffic issues in rhoam it would be usefull to have access to 3scale metrics like rails_requests_total or apisonator_listener_response_codes
What
Investigate getting 3scale metrics available in rhoam prometheus
How
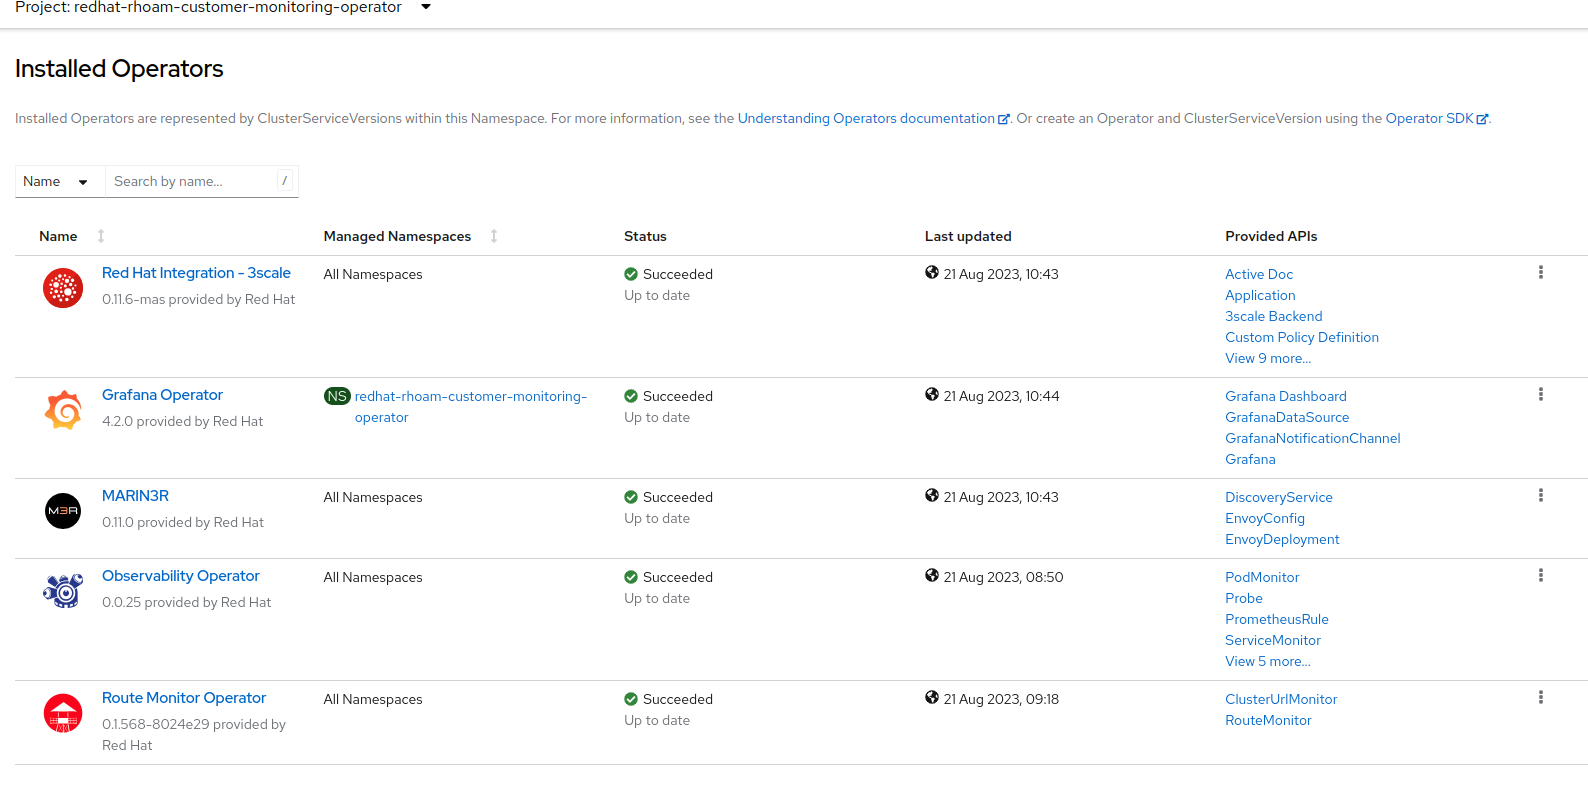
3scale has its own monitoring stack which we can enable in the apimanger CR
spec:
  monitoring:
    enablePrometheusRules: false
    enabled: true
We are disabling PrometheusRules as we don't require extra alerts
There is a doc for enabling monitoring in the 3scale repo https://github.com/3scale/3scale-operator/tree/master/doc/monitoring-stack-deployment
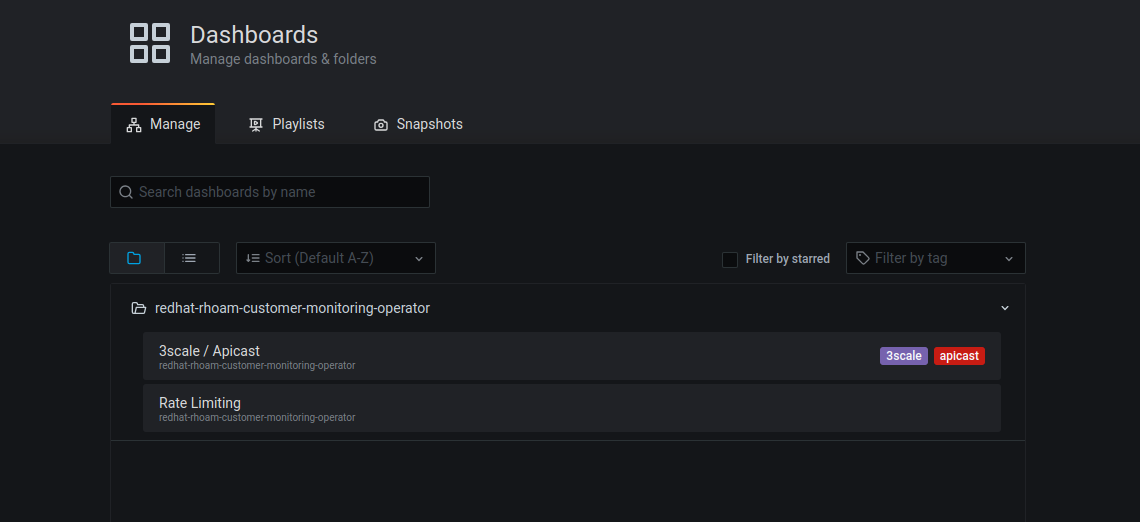
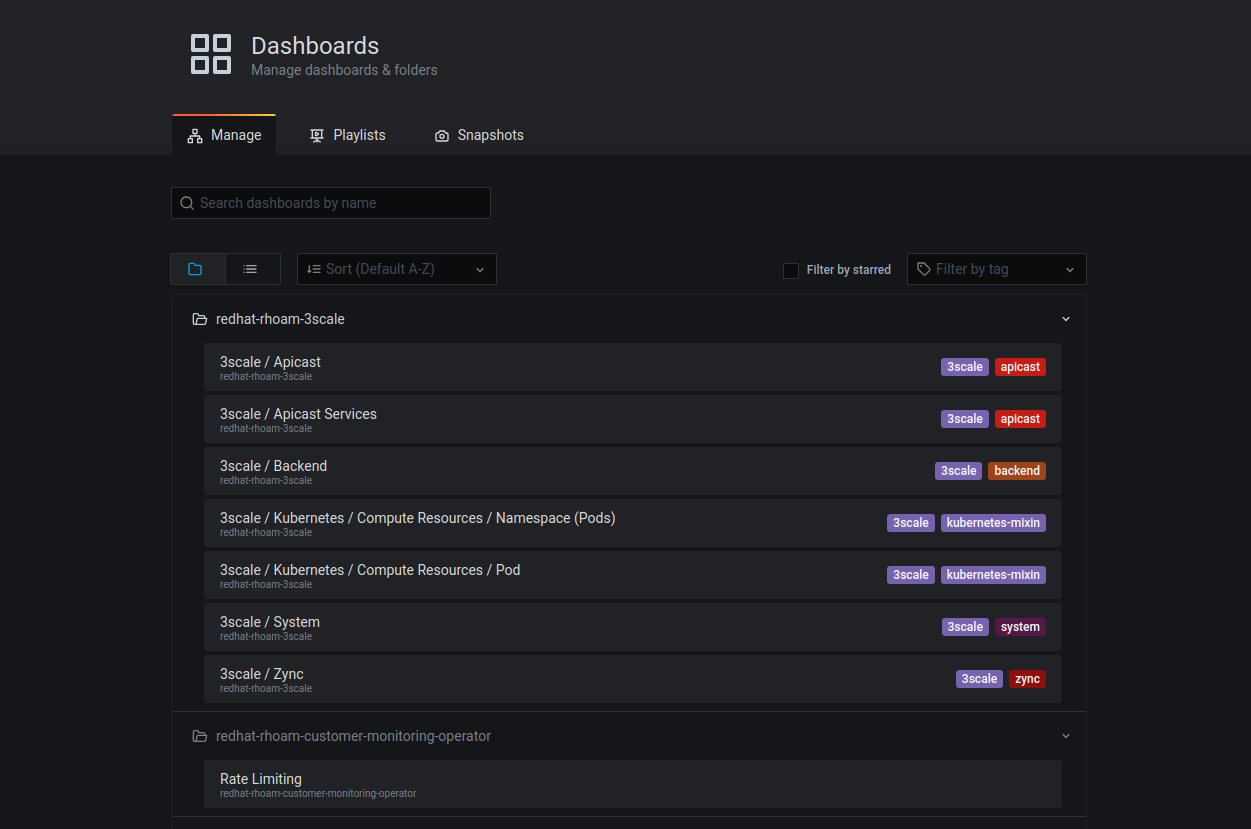
We need to consider how we manage Grafana dashboard that get generated if we remove the grafana operator from RHOAM
- Add hard coded Dashboard JSON to Integr8tly
- Add Grafana CRDs, parse the CRs and call the Grafana APIs
Another option is to refactor the 3scale operator to prevent the dashboard generation.
Done
A demo of this working and a follow up jira on implementing it.
Verify if the metrics provided help with providing the information required in this JIRA


- is cloned by
-
MGDAPI-6005 Set 3scale metrics in rhoam
-
- Closed
-
