-
Task
-
Resolution: Done
-
Major
-
None
-
None
Current metrics only report HTTP response codes.
gRPC status are included as headers being part of a 200 HTTP response, so all the reporting in Prometheus for gRPC request/responses miss the actual gRCP status and use the HTTP response as value.
For instance, a success gRPC response is described using the following Istio attibutes:
- response.grpc_status = 0
- response.code = 200
A gRPC error response may look like:
- response.grpc_status = 14
- response.code = 200
As you can tell from the examples above, both response.code are 200, which are finally set as 'response_code' label in metrics and deals to interpretation problems with gRPC protocol metrics.
One example is the current 'requestcount' metric which set the 'response_code' label as follows:
response_code: response.code | 200
To workaround this issue and be able to include grpc_status when protocol is gRPC, I tried to extend it:
response_code: conditional((api.protocol | context.protocol | "unknown") == "grpc", response.grpc_status, (response.code | 200) )
But it does not work, because 'response.grpc_status' type is String while 'response.code' is int64. Mixer expression validation fails, expression resolves to 2 different types.
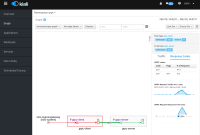
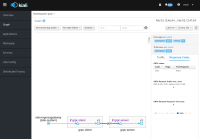
Having proper metrics for gRPC protocol would add lot of value to Kiali graphs/metrics and Grafana dashboards.


