-
Bug
-
Resolution: Unresolved
-
 Normal
-
None
-
Logging 6.2.4
-
None
-
Incidents & Support
-
False
-
-
False
-
NEW
-
NEW
-
Bug Fix
-
-
-
Moderate
Description of problem:
It's configured 3 clusterLogForwarders:
- test-collector-application: log forwarding to cloudwatch
- test-collector-audit: log forwarding to cloudwatch and syslog
- test-collector-infrastructure: log forwarding to cloudwatch
For the "clusterLogForwarder: test-collector-infrastructure", the metric for the "aws_cloudwatch_logs" output is observed when reviewing the Dashboard "Logging / Collections: Log send rate". Querying directly to get the metrics from the service, the metric is:
$ grep -i https 0170-metrics_infrastructure
vector_component_sent_bytes_total{component_id="output_test_infrastructure_cloudwatch",component_kind="sink",component_type="aws_cloudwatch_logs",host="node.example.com-collector-infrastructure-xbvwm",hostname="node.example.com-",protocol="https",region="eu-central-1"} 135100613621 1760449483698
For the "test-collector-audit" and "test-collector-application", for the "aws_cloudwatch_logs" outputs, it's generated the metric "vector_component_sent_bytes_total" , but it doesn't not contain the "component_*" fields causing the data not being present in the "Logging / Collections: Log send rate" as the query filters by the "component_kind="sink""
$ grep -i https 0160-metrics_app
vector_component_sent_bytes_total{host="node.example.com",hostname="node.example.com",protocol="https",region="eu-central-1"} 18373815575 1760449477997
$ grep -i https 0150-metrics_audit
vector_component_sent_bytes_total{host="node.example.com",hostname="node.example.com",protocol="https",region="eu-central-1"} 530959816 1760449489161
Version-Release number of selected component (if applicable):
$ oc get csv |grep -i logging
cluster-logging.v6.2.4                        Red Hat OpenShift Logging                  6.2.4     cluster-logging.v6.2.3                         Succeeded
How reproducible:
Not able to replicate in a lab. Able to observe always in the productive environment
Actual results:
- Not able to see in the "Dashboard: Logging / Collection > Log send rate" the metrics for all the collectors log forwarding to Cloudwatch
- When queried from the ClusterLogging Operator pod the metrics service for the clusterLogForwarder CR that missing to be printed in the "Logs send rate", it's observed the metric "vector_component_sent_bytes_total" is present missing the "component_*" fields:
$ grep -i https 0160-metrics_app
vector_component_sent_bytes_total{host="node.example.com",hostname="node.example.com",protocol="https",region="eu-central-1"} 18373815575 1760449477997
$ grep -i https 0150-metrics_audit
vector_component_sent_bytes_total{host="node.example.com",hostname="node.example.com",protocol="https",region="eu-central-1"} 530959816 1760449489161
-
- # When queried from the ClusterLogging Operator pod the metrics service for the clusterLogForwarder CR that missing to be printed in the "Logs send rate", it's observed the metric "vector_component_sent_event_bytes" is present and with the field "component_*" fields:
$ grep vector_component_sent_event_bytes 0150-metrics_audit |grep "component_type=\"aws_cloudwatch_logs"
vector_component_sent_event_bytes_total{component_id="output_test_audit_cloudwatch",component_kind="sink",component_type="aws_cloudwatch_logs",host="node.example.com",hostname="node.example.com"} 477587654 1760449489161
- # When queried from the ClusterLogging Operator pod the metrics service for the clusterLogForwarder CR that missing to be printed in the "Logs send rate", it's observed the metric "vector_component_sent_event_bytes" is present and with the field "component_*" fields:
This issue seems to be exactly the same reported in upstream issue: https://github.com/vectordotdev/vector/issues/20356.
Expected results:
In the Dashboard "Logging / Collection", in "Log send rate" is present the values for the bytes send to CloudWatch for all the ClusterLogForwarder CR
Additional info:
- in this issue reported in Red Hat, the issue is not present in the 3 CLF, the missing "component_*" labels for the metric vector_component_sent_bytes_total are missing in only 2 of the 3 ClusterLogForwarder CR for cloudWatch
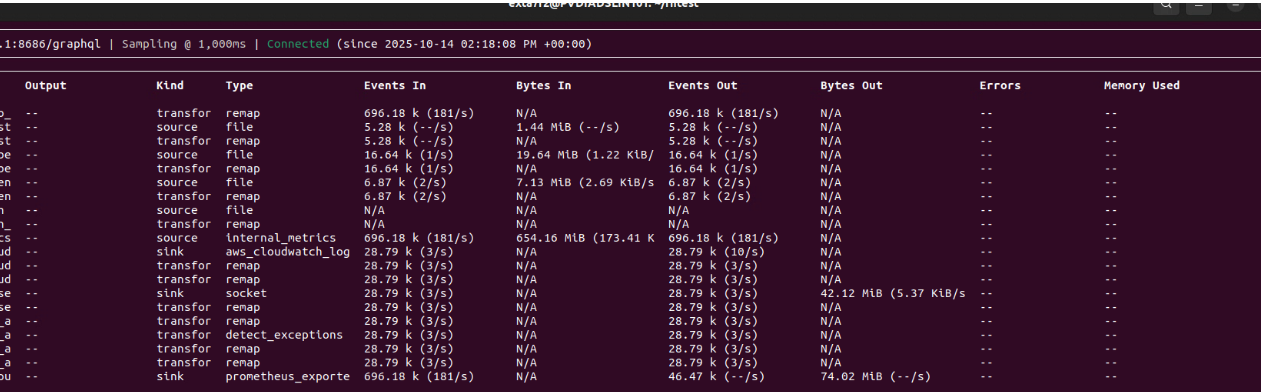
- If it's used "vector top" from one of the collectors where not producted the metric with the "component_*" labels, it's observed that in the column "Events Out" shows values, but not in the "Bytest Out" that remains as N/A
$ oc rsh test-collector-application-79gfz
sh-5.1# vector top

- In the case that needed to be reviewed the "Logs send", it could be considered to use the metric "component_sent_event_bytes_total" instead of "vector_component_sent_bytes_total"
