-
Bug
-
Resolution: Unresolved
-
 Normal
-
None
-
Logging 6.3.z
-
Incidents & Support
-
False
-
-
False
-
NEW
-
NEW
-
Bug Fix
-
-
-
Logging - Sprint 278, Logging - Sprint 279, Logging - Sprint 280, Logging - Sprint 281, Logging - Sprint 282
-
Moderate
Description:
When it's configured the tuning option: `atLeastOnce`, it should be expected that:
1. Checkpoints not longer updated. The journald checkpoint keeps being updated some of the fields (description fields in [0]):
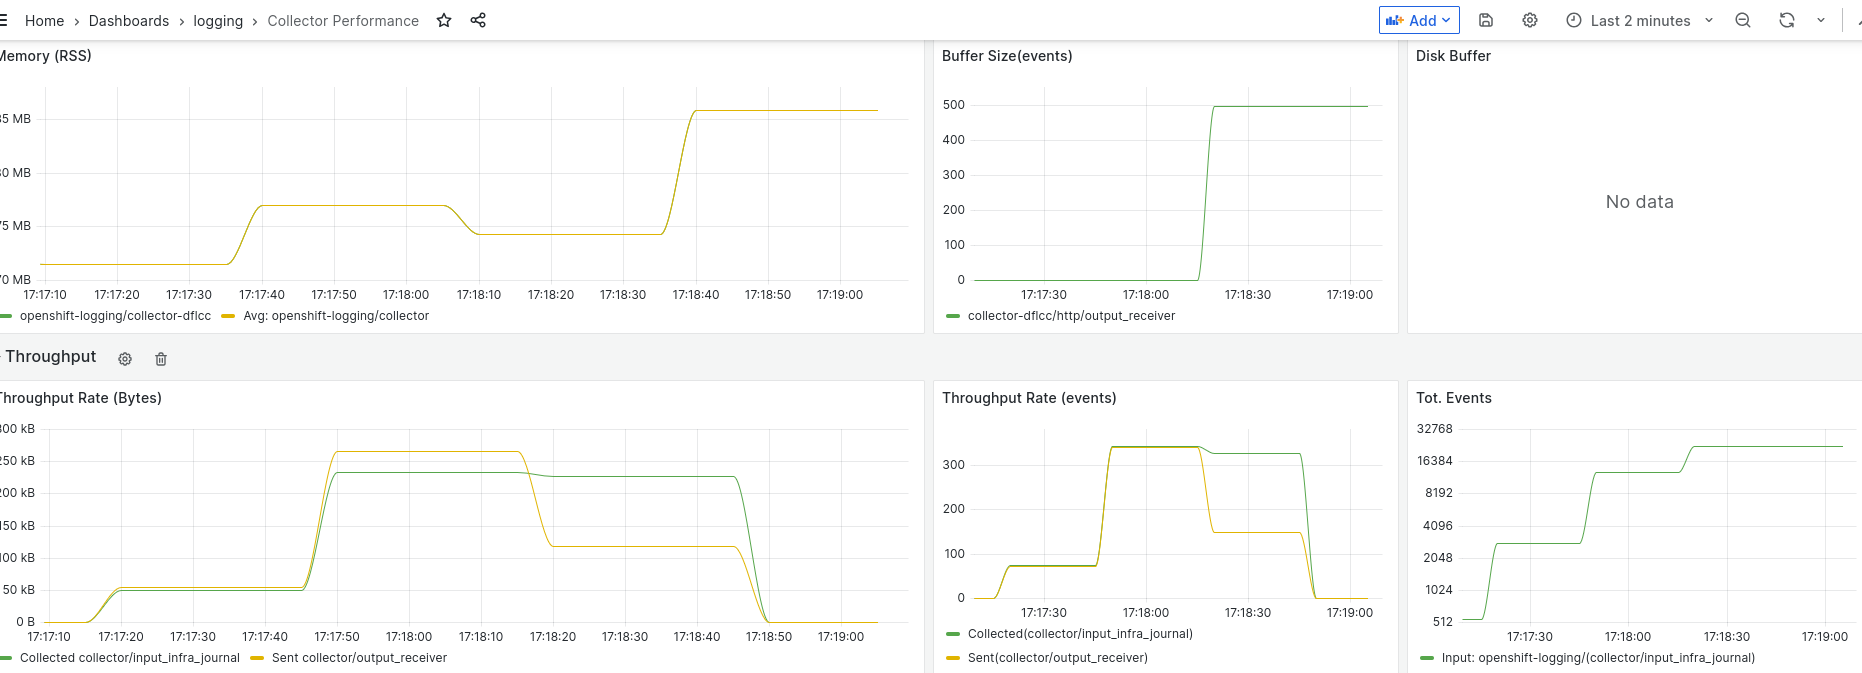
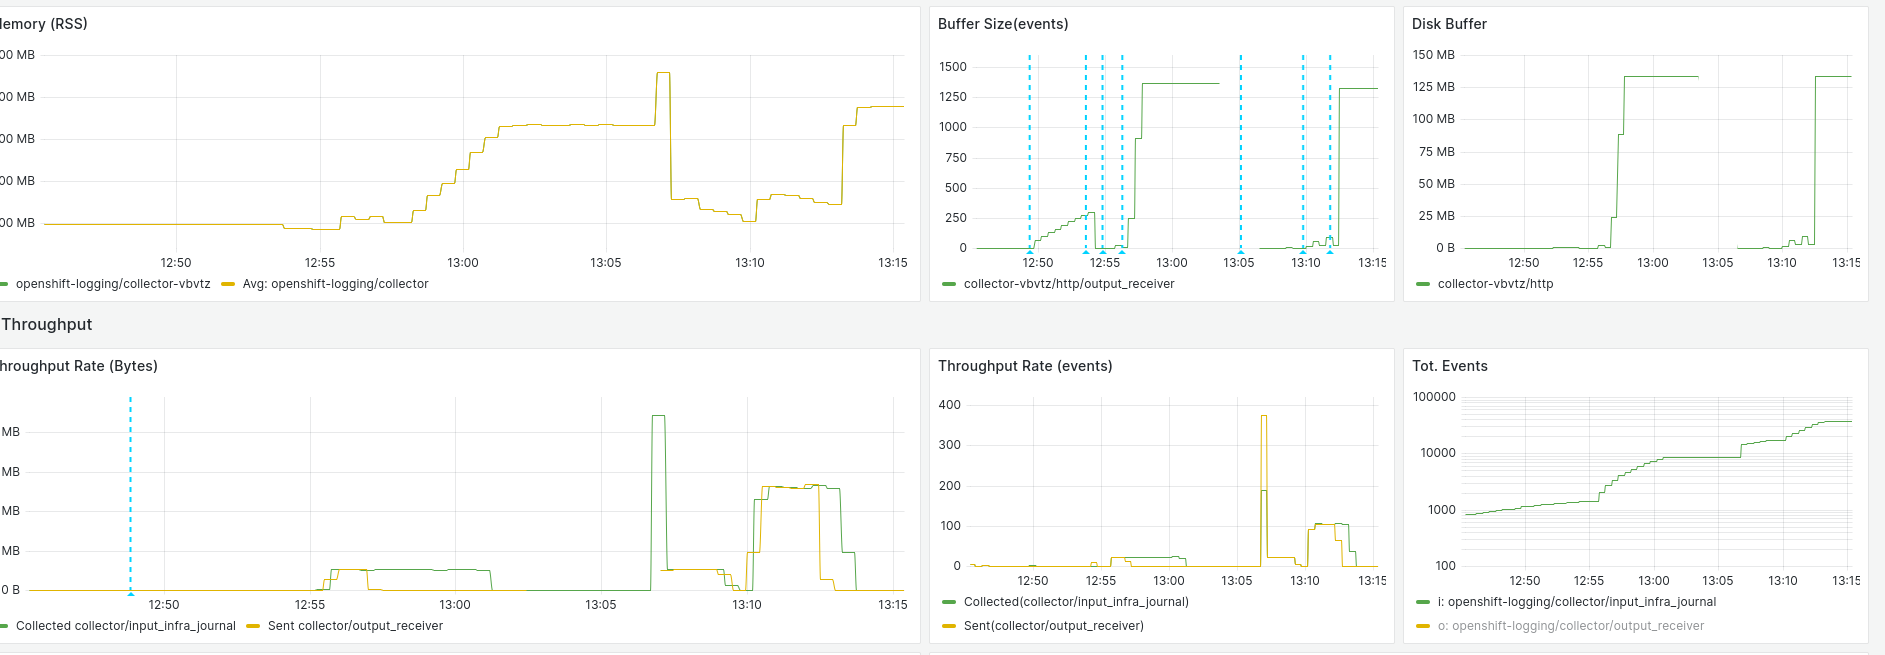
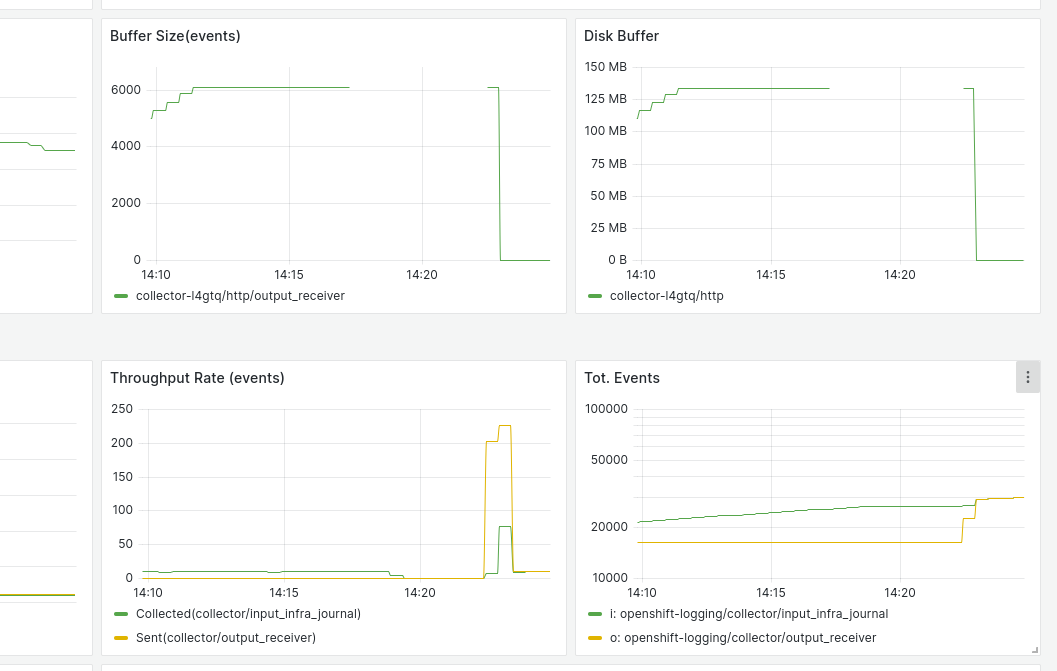
2. The buffer size per output is 256M. When not able to deliver the events, then, it should be expected to see how Vector continues reading logs until reaching the buffer size of 256M. This doesn't happen
3. The buffer size is not reduced, at least that the logs are started again to be delivered to the destination
4. The buffer outputs are independent in the sink when log forwarding to Loki, but it stops of storing in the disk buffers assigned to the sinks all at the same time. This could indicate dependency on the pipeline.
Env
$ oc get csv
NAME DISPLAY VERSION REPLACES PHASE
cluster-logging.v6.3.0 Red Hat OpenShift Logging 6.3.0 Succeeded
cluster-observability-operator.v1.2.2 Cluster Observability Operator 1.2.2 cluster-observability-operator.v1.2.1 Succeeded
loki-operator.v6.3.0 Loki Operator 6.3.0 Succeeded
Yaml files used with the configurations will be attached to the support case for reference
How reproducible:
Always
Steps to Reproduce:
1. Deploy an OpenShift cluster with Logging and Loki 6.3
2. Create the `test` project
$ oc new-project test
3. Edit the `app_pod.yaml` and `infra_pod.yaml` files attached and set the `nodeName` in both files to a worker node in the cluster, the same in both files and create the resource. This will deploy some pods generating logs for being ingested as `application` logs
$ oc create -f app_pod.yaml
$ oc create -f infra_pod.yaml
5. Let's delete the `clusterLogForwarder` CR and delete the directory `/var/lib/vector` for allowing to Vector to recreate them
$ oc delete -f obsclf.yaml
$ for node in $(oc get nodes -o name); do oc debug $node – chroot /host /bin/bash -c "rm -rf /var/lib/vector/*" ; done
6. Let's set the node variable to the same node defined in the `app_pod.yaml` and `infra_pod.yaml` files
7. Let's start to monitor the timestamp of the checkpoints and the size of the buffers on disk. This will keep the outputs in the `result` file also attached to the case
$ node="<node name>"
$ [ -e result ] && rm result || echo "nothing to do"; for i in $(seq 1 1000); do echo "### iteration: $i ###"; oc debug $node – /bin/bash -c "date ; ls -l /host/var/lib/vector/openshift-logging/collector/input_infrastructure_container /host/var/lib/vector/openshift-logging/collector/input_infrastructure_journal /host/var/lib/vector/openshift-logging/collector/input_application_container ; du -khs /host/var/lib/vector/openshift-logging/collector/buffer/v2/output_default_lokistack_infrastructure/* /host/var/lib/vector/openshift-logging/collector/buffer/v2/output_default_lokistack_application/* |grep data" 2>/dev/null 1>> result; sleep 5; done
8. Let's move to Unmanaged the Loki CR
$ oc -n openshift-logging patch lokistack/logging-loki -p '\{"spec":{"managementState": "Unmanaged"}}' --type=merge
9. Let's scale down the Loki Ingesters pods to be only 1. With this, the logs delivered by the collectors will fail to deliver as the replication factor is 2 and the buffers should start to increase
$ date ; oc scale sts/logging-loki-ingester --replicas=1 -n openshift-logging
Fri Aug 15 03:22:02 PM CEST 2025
statefulset.apps/logging-loki-ingester scaled
Actual results:
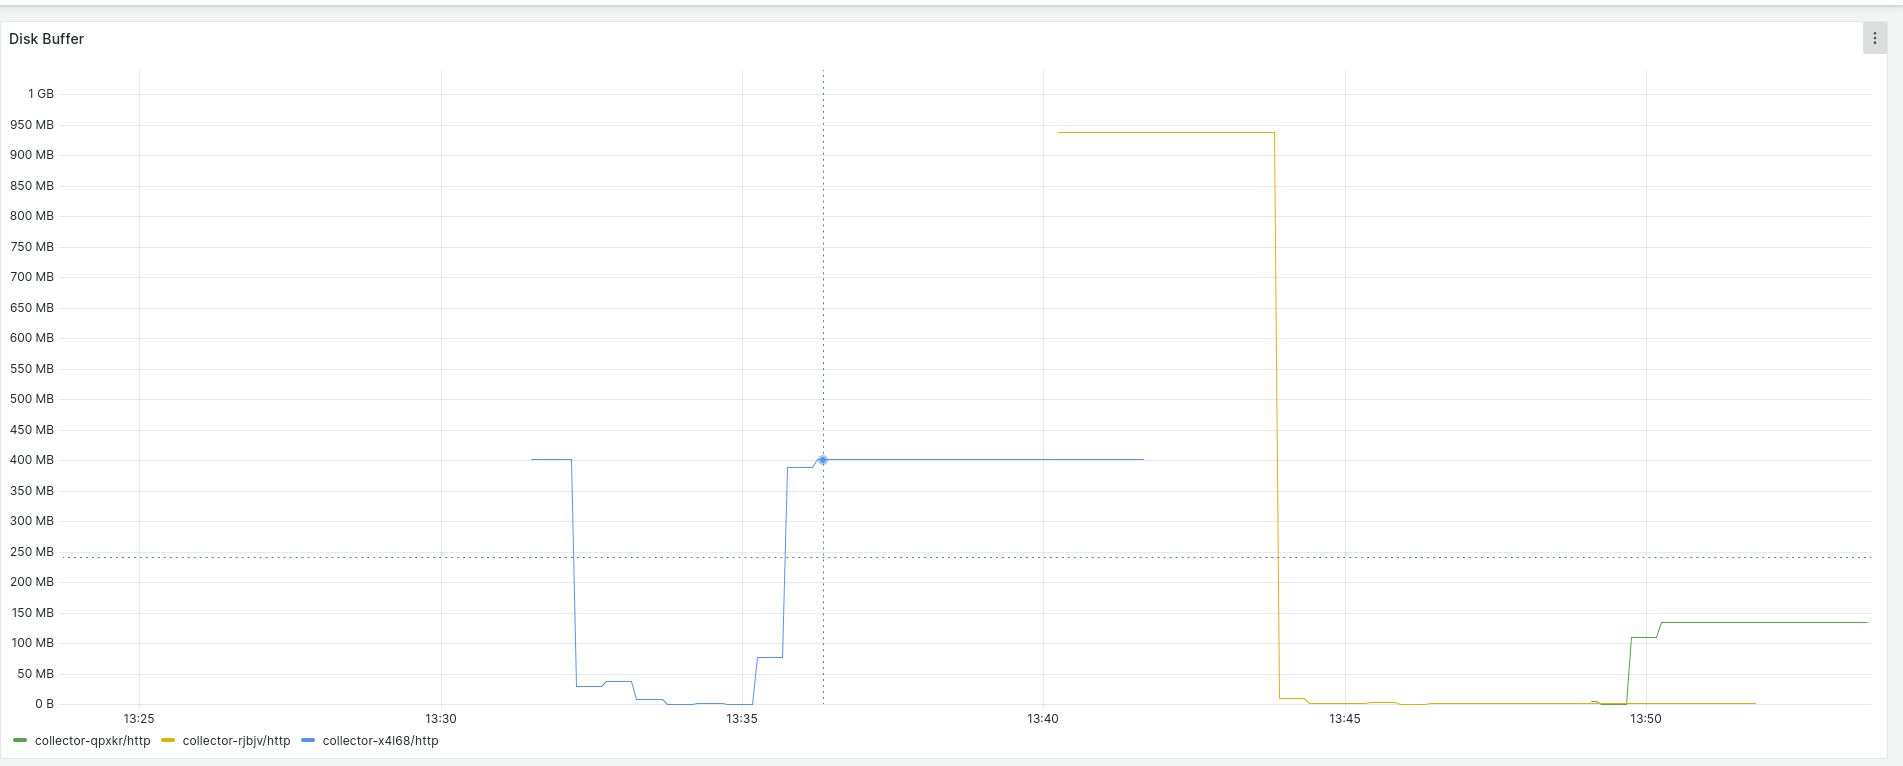
Buffer on disk changes its size reducing it
Note: This behaviour is not always visible, but it happens sometimes.
Let's delete the collector pod running in the same node that the pods created for generate load (The date returned here is UTC +2):
$date; oc delete pod $(oc get pods -o wide -n openshift-logging|grep $node |grep collector|awk '

{print $1}')
Fri Aug 15 03:25:44 PM CEST 2025
pod "collector-9flf2" deleted
Let's verify that the `output_default_lokistack_infrastructure/buffer-data-138.dat` has reduced its size from 70M to 40M. The date inside the "results" file is UTC time.
// Before restart
Fri Aug 15 13:25:35 UTC 2025
[...]
128M /host/var/lib/vector/openshift-logging/collector/buffer/v2/output_default_lokistack_infrastructure/buffer-data-137.dat
70M /host/var/lib/vector/openshift-logging/collector/buffer/v2/output_default_lokistack_infrastructure/buffer-data-138.dat
128M /host/var/lib/vector/openshift-logging/collector/buffer/v2/output_default_lokistack_application/buffer-data-128.dat
69M /host/var/lib/vector/openshift-logging/collector/buffer/v2/output_default_lokistack_application/buffer-data-129.dat

// After restart
Fri Aug 15 13:25:56 UTC 2025
[...]
128M /host/var/lib/vector/openshift-logging/collector/buffer/v2/output_default_lokistack_infrastructure/buffer-data-137.dat
40M /host/var/lib/vector/openshift-logging/collector/buffer/v2/output_default_lokistack_infrastructure/buffer-data-138.dat
128M /host/var/lib/vector/openshift-logging/collector/buffer/v2/output_default_lokistack_application/buffer-data-128.dat
69M /host/var/lib/vector/openshift-logging/collector/buffer/v2/output_default_lokistack_application/buffer-data-129.dat
Checkpoint file for the journald keeps always being updated changing the `s`, `i` , `m`, `t` and `x` fields:
$ oc -n openshift-logging rsh $(oc get pods -o wide -n openshift-logging|grep $node |grep collector|awk '\{print $1}')
sh-5.1# cd /var/lib/vector/openshift-logging/collector/input_infrastructure_journal
sh-5.1# cp checkpoint.txt /tmp/1.txt

// wait 1 - 2 minutes
sh-5.1# cp checkpoint.txt /tmp/2.txt
sh-5.1# cat /tmp/1.txt /tmp/2.txt
s=0230eaef76d84405ae329c094ae93b33;i=21c51;b=67b9ae277476421aa9f3943a0e81631f;m=243e777b53;t=63c67a34a632c;x=9e2d19baff263028
s=0230eaef76d84405ae329c094ae93b33;i=21dd8;b=67b9ae277476421aa9f3943a0e81631f;m=2440fde8a6;t=63c67a5d0d07f;x=7afa29d3093c04a5
Going to the "OpenShift Console > Observe > Metrics" and run the promql below. Replace `<node name>` by the value of the variable "node" set on the 7 point and it will be observed as journald events continue being read, even when never stored in the buffer file. See screenshot journald_events.png)
rate(vector_component_received_events_total {component_kind="source", component_type!="internal_metrics",hostname="<node name>"} [5m])
See screenshot "journald_events.png" for the metric result.
Buffer on disk should be expected to reach the maximum size: 256M
It's set 256M of buffer on disk per sink. This size is never reached and stopped of ingesting logs before in all the outputs.
All the buffers for the Loki output are stopped of adding more data at the same time
As the outputs are independent and the same for the inputs, it should be expected that every one of them stops of reading logs only when the buffer size on disk is reached: 256M.
This doesn't happen and it's stopped of buffering to disk all the outputs at the same time:
$ egrep "buffer-data-128|buffer-data-129|buffer-data-137|buffer-data-138" result|tail -8
128M /host/var/lib/vector/openshift-logging/collector/buffer/v2/output_default_lokistack_infrastructure/buffer-data-137.dat
42M /host/var/lib/vector/openshift-logging/collector/buffer/v2/output_default_lokistack_infrastructure/buffer-data-138.dat
128M /host/var/lib/vector/openshift-logging/collector/buffer/v2/output_default_lokistack_application/buffer-data-128.dat
69M /host/var/lib/vector/openshift-logging/collector/buffer/v2/output_default_lokistack_application/buffer-data-129.dat
[0]
 - *{*}`s` (Boot ID){*}{*}: This is a **unique identifier for a specific system boot{*}*. All journal entries from a single boot session share the same boot ID. This helps Vector distinguish between log entries from different system restarts.

 - *{*}`i` (Inode){*}{*}: The **inode{*}* is an index node that uniquely identifies a file on a file system. In this context, it points to the specific journal file on disk where the log entry is stored.

 - *{*}`b` (Boot Log ID){*}*: This is another unique ID that specifically identifies the log file within a particular boot.

 - *{*}`m` (Monotonic Timestamp){*}{*}: This timestamp measures the number of microseconds since the system was last booted. It's a **reliable way to chronologically order events{*}* within a single boot, as it's not affected by system time changes.

 - *{*}`t` (Realtime Timestamp){*}*: This is the standard Unix timestamp, representing the number of microseconds since January 1, 1970. It provides a universal time reference for the log entry.

 - *{*}`x` (Random Hash){*}{*}: This is a **randomly generated hash{*}* that ensures the entire journal entry ID is globally unique. It helps prevent ID collisions, even if other parts of the identifier (like boot ID or timestamps) happen to be the same.
h4. Expected results
It's needed to understand:
- Why the journald logs continue being read
- Why all the buffer files on disk are not storing more events at the same time. Probably, it's caused as part of the pipeline for the infrastructure and application container logs is shared?
- Why the collector doesn't continue reading logs until reaching the buffer max size on disk set: 256M

