-
Bug
-
Resolution: Not a Bug
-
 Undefined
-
None
-
Logging 5.9.z
-
False
-
-
False
-
NEW
-
NEW
-
Bug Fix
-
-
-
Important
Description of problem:
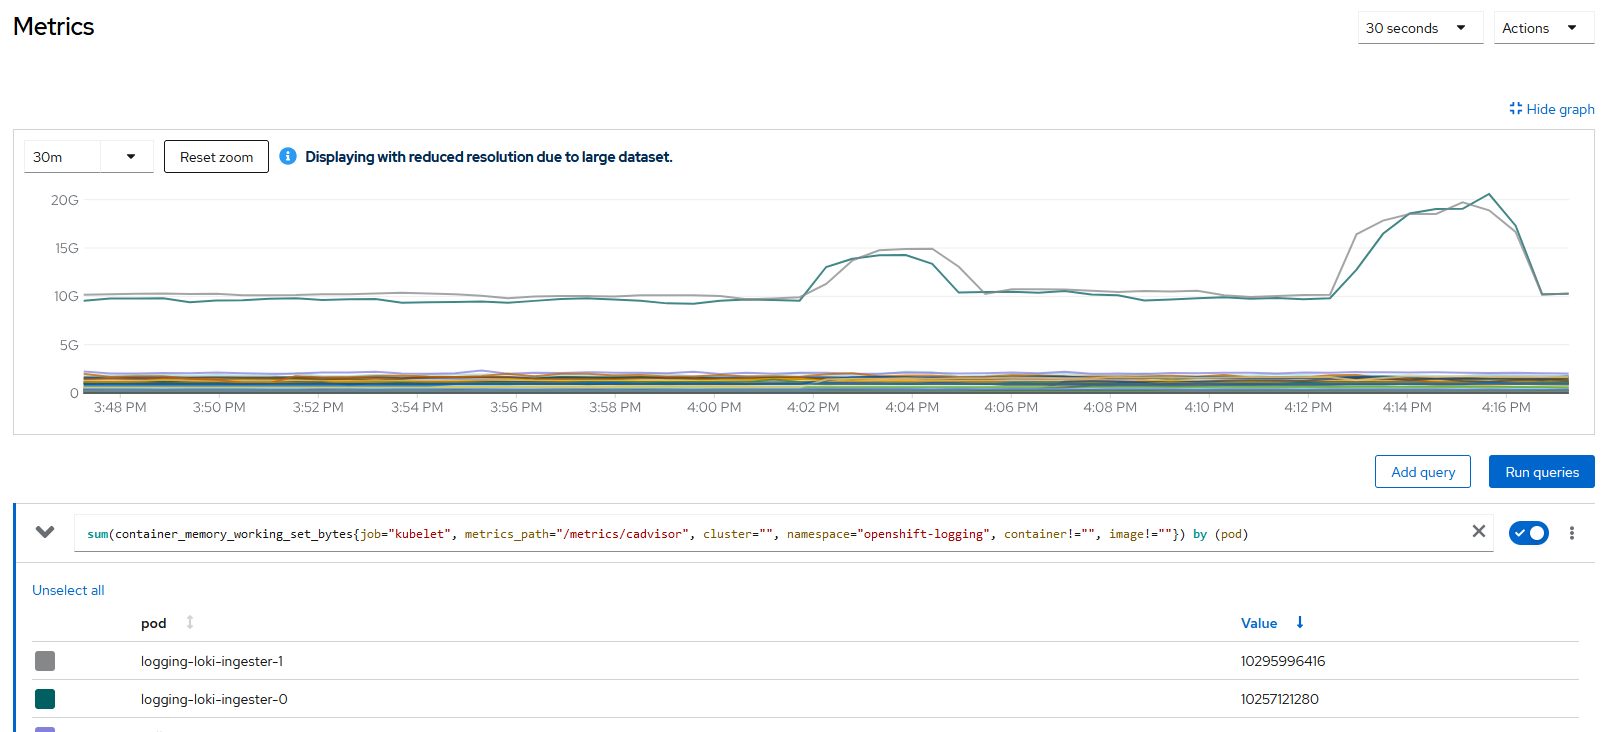
When it's requested in `OpenShift Console > Dashboards > Observe > Logs` the Histogram for several hours, the memory usage of the Loki pods increase more than 20G reaching some times the limit of the node memory crashing the pod.

Version-Release number of selected component (if applicable):
Loki 5.9.z
ClusterLogging 5.9.7
How reproducible:
Always
Steps to Reproduce:
- Generate logs to be ingested by Loki during some hours
- Log into the `OCP Console > Observe > Logs` change the time for being 6 hours or 12 hours or 24 hours
- Press the Show Histogram button
- The Lokistack CR querier section was modified like:
```
spec:
  limits:
    global:
...
      queries:
        maxChunksPerQuery: 100
        maxEntriesLimitPerQuery: 500000  <--- this values is increased 100x respected to the default
        maxQuerySeries: 10000  <--- this value is increased 20x respected to the default
        queryTimeout: 1m:
```
Actual results:
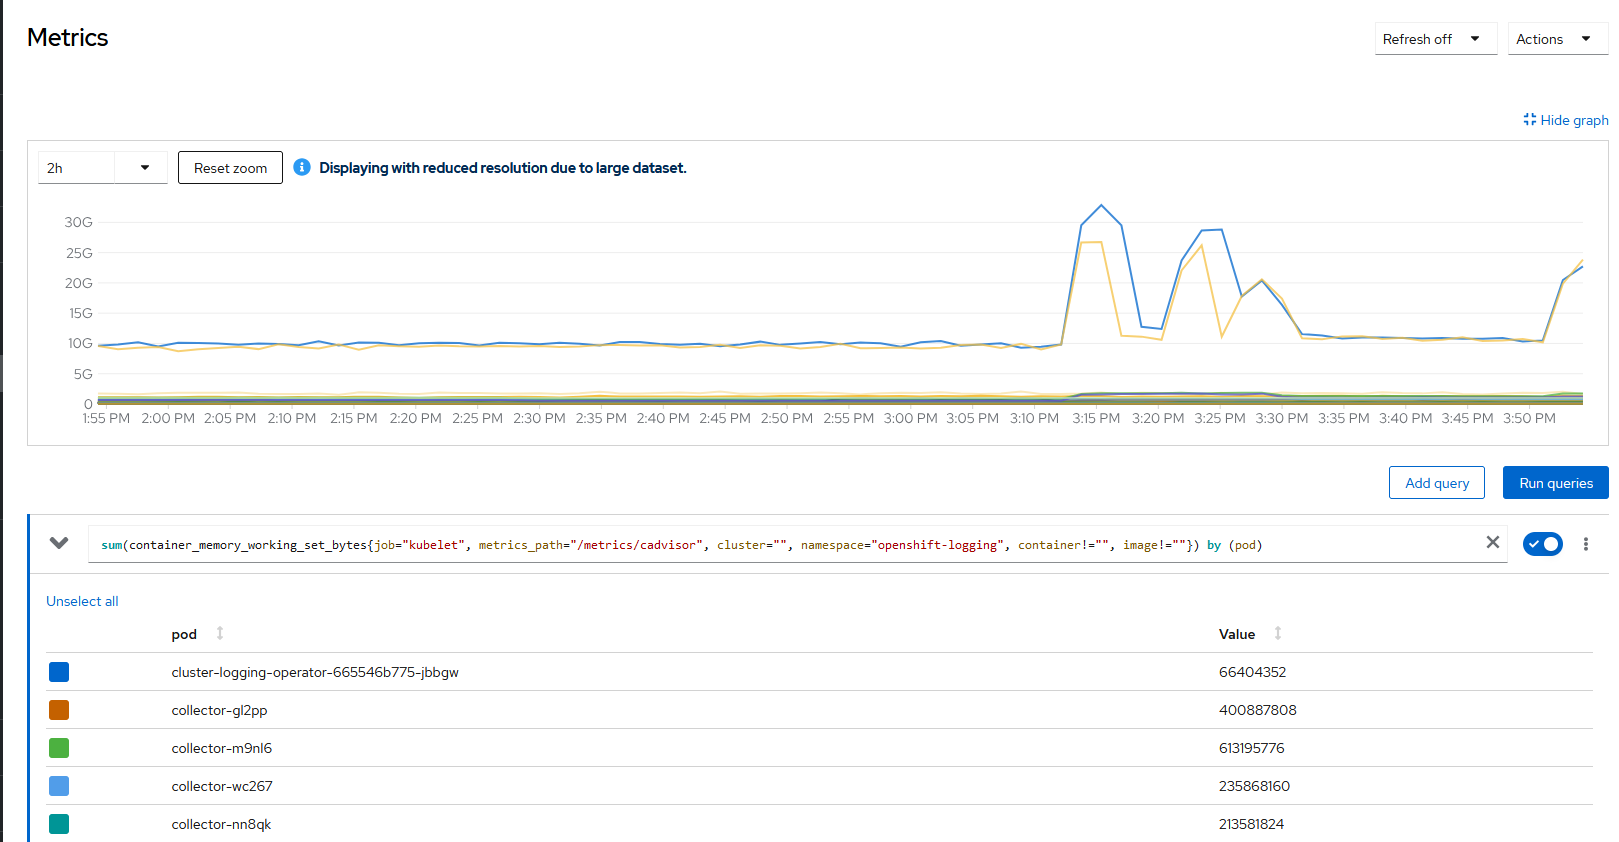
The memory usage by the Loki Components goes up increasing in 20G/40G as observed in the screenshot attached above.
It's visible in the next logs provided that the queries causing the usage memory are coming from the Histogram query and not for when requesting the logs for the same period.
Big usage of memory between ~3:12 - ~3:16 and ~3:20 - ~3:30 (the times are GMT +2) where:
Queries for the Histogram are matching the high memory usage failing with `context deadline` with a high number of retries:
// Number of apparitions of the query coming from the Histogram
 $ grep T13:10 logging-loki-query-frontend-7899fcb46f-7thlh.log |grep -c count_over_time
0
$ grep T13:11 logging-loki-query-frontend-7899fcb46f-7thlh.log |grep -c count_over_time
0
$ grep T13:12 logging-loki-query-frontend-7899fcb46f-7thlh.log |grep -c count_over_time
454
$ grep T13:13 logging-loki-query-frontend-7899fcb46f-7thlh.log |grep -c count_over_time
418
$ grep T13:14 logging-loki-query-frontend-7899fcb46f-7thlh.log |grep -c count_over_time
418
$ grep T13:15 logging-loki-query-frontend-7899fcb46f-7thlh.log |grep -c count_over_time
417
$ grep T13:16 logging-loki-query-frontend-7899fcb46f-7thlh.log |grep -c count_over_time
1

// These queries are retrying continually and failing with "context canceled"
level=error ts=2024-10-31T13:13:23.681799978Z caller=retry.go:95 org_id=application msg="error processing request" try=0 query="sum by (level)(count_over_time({log_type=\"application\"..
...
retry_in=415.277808ms err="context canceled"
Queries for viewing the logs are finishing in a pretty period of time with success and in the first minute.
// Duration of the queries for the logs around ~25 seconds
0001-01-01 00:00:00  [INFO] ts=2024-10-31T13:12:23.708687154Z query_type=limited range_type=range length=1h0m0s duration=21.894137477s status=200 throughput=35MB total_bytes=768MB
0001-01-01 00:00:00  [INFO] ts=2024-10-31T13:12:34.795818654Z query_type=limited range_type=range length=6h0m0s duration=27.297799408s status=200 throughput=28MB total_bytes=770MB

// Number of queries in the same minutes that the high memory usage where shows that these type of queries are not the problem
$ grep T13:10 logging-loki-query-frontend-7899fcb46f-7thlh.log |grep -vc count_over_time
0
$ grep T13:11 logging-loki-query-frontend-7899fcb46f-7thlh.log |grep -vc count_over_time
1
$ grep T13:12 logging-loki-query-frontend-7899fcb46f-7thlh.log |grep -vc count_over_time
6
$ grep T13:13 logging-loki-query-frontend-7899fcb46f-7thlh.log |grep -vc count_over_time
0
$ grep T13:14 logging-loki-query-frontend-7899fcb46f-7thlh.log |grep -vc count_over_time
0
$ grep T13:15 logging-loki-query-frontend-7899fcb46f-7thlh.log |grep -vc count_over_time
0
$ grep T13:16 logging-loki-query-frontend-7899fcb46f-7thlh.log |grep -vc count_over_time
0
Expected results:
The number of retries for the Histogram and the high memory used by Loki are leading to crash the pods and impacting in all the loads running in the same node when asking for the Histogram.
Then, even if the memory usage for the query done for the Histogram was the expected and not a bug is there, then, the product is doing by default a query that when asking for the logs it works fast, but when pressing the "Show Histogram" leads to the Loki pods to use so much memory and also impact in all the loads in the node causing big issues.
It should be expected a way of protecting Loki or not offering the Histogram option, or and/or limiting the retries by default done or other way considered for not having the impact observed.
NOTE: this ticket could be partially related to https://issues.redhat.com/browse/LOG-5521
- is related to
-
LOG-6417 Investigate performance improvements to "Show histogram" button
-
- To Do
-
- links to
