-
Bug
-
Resolution: Done-Errata
-
 Normal
-
Logging 5.8.10
-
False
-
-
False
-
NEW
-
VERIFIED
-
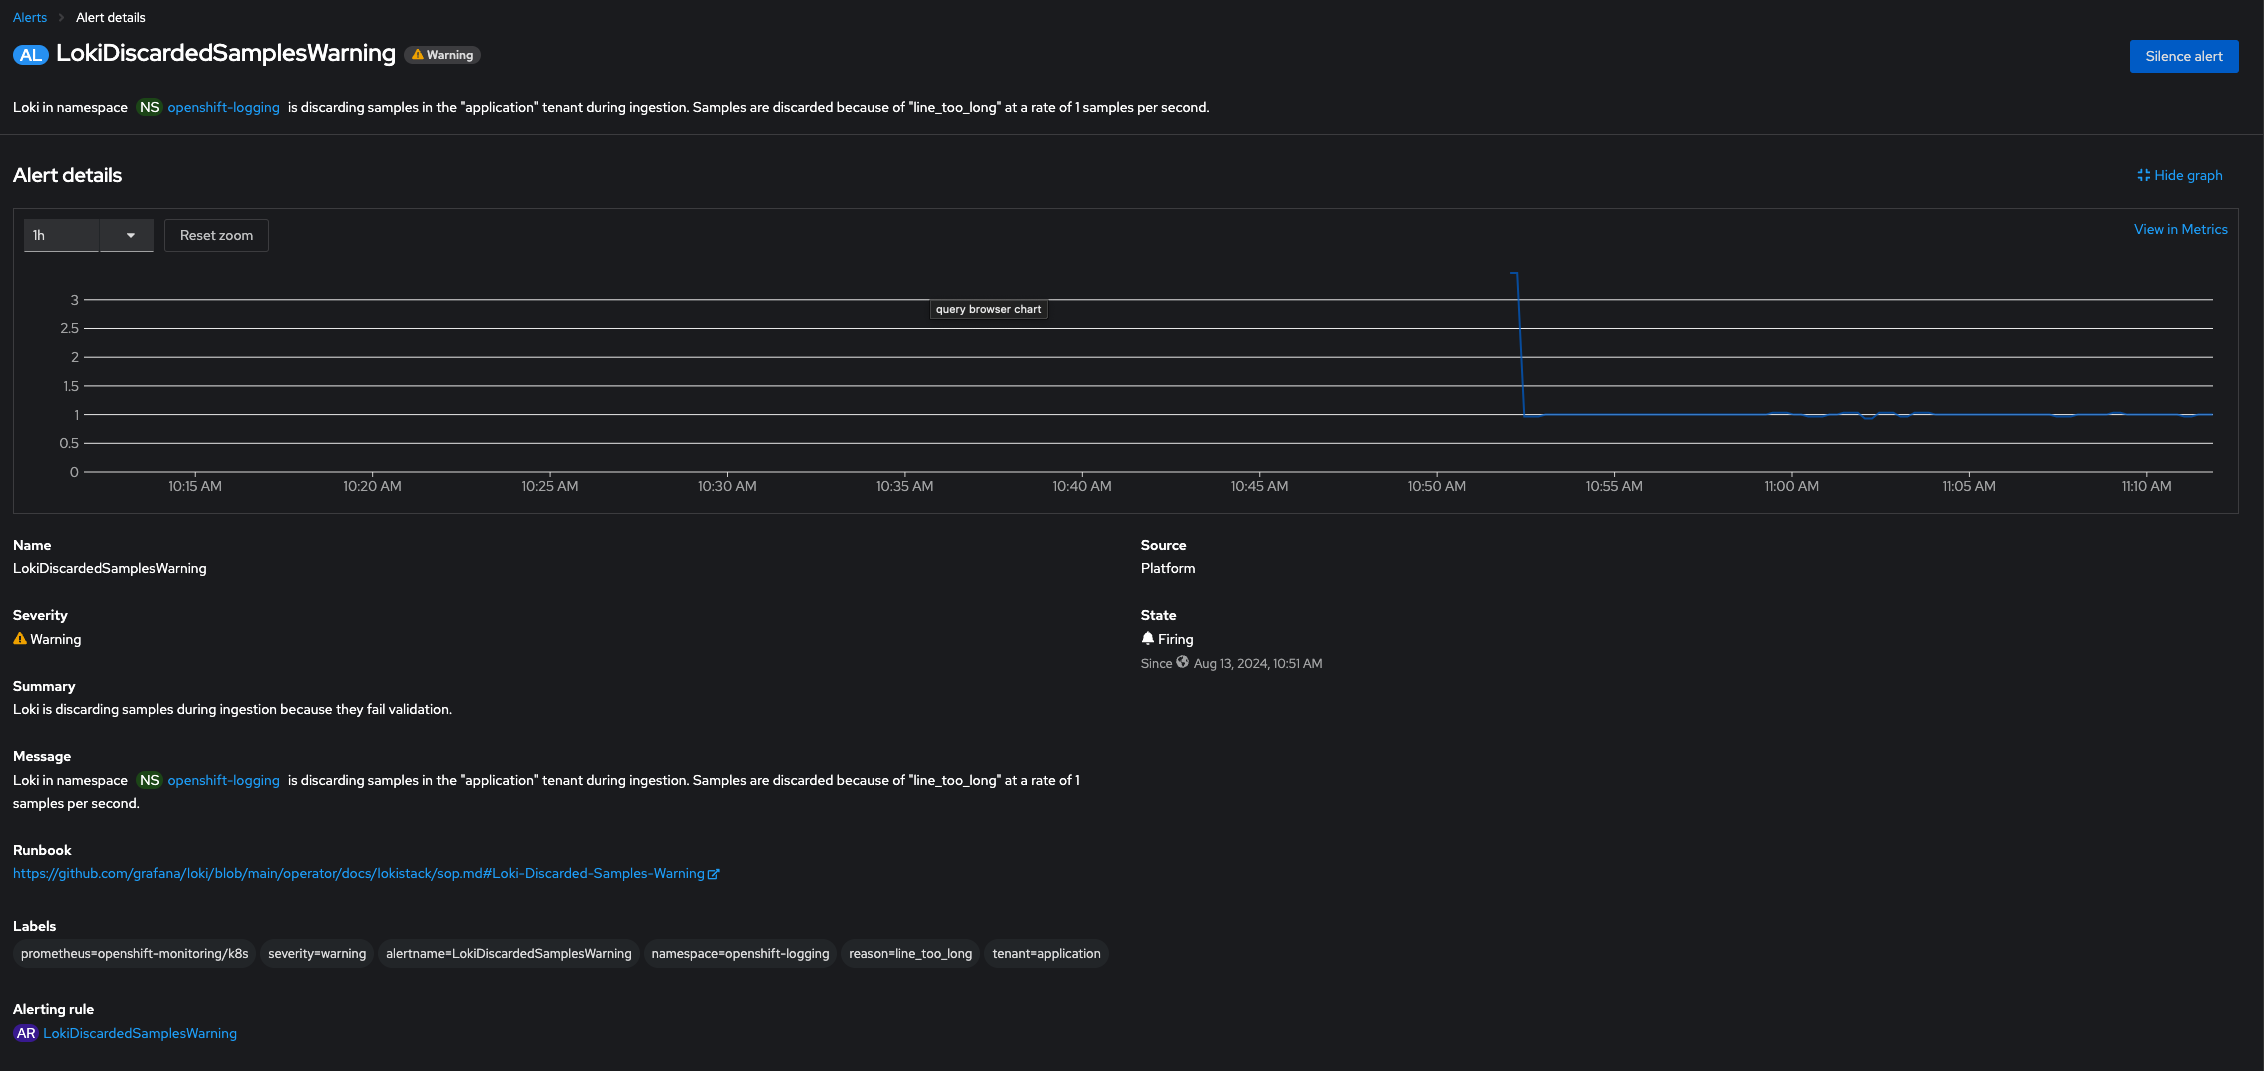
With this update, Loki Operator contains a new alert definition that will trigger an alert if Loki needs to drop log events because they fail validation.
-
Enhancement
-
-
-
Log Storage - Sprint 256, Log Storage - Sprint 257, Log Storage - Sprint 258
-
Important
Description of problem:
Some logs are discarded by Loki silently.
Version-Release number of selected component (if applicable):
$ oc get csv
NAME                                    DISPLAY                     VERSION   REPLACES                                PHASE
cluster-logging.v5.9.3                  Red Hat OpenShift Logging   5.9.3     cluster-logging.v5.9.2                  Succeeded
loki-operator.v5.9.3                    Loki Operator               5.9.3     loki-operator.v5.9.2                    Succeeded
How reproducible:
Always
Steps to Reproduce:
Install Vector + Loki where the CLO and CLF are as below (even is not enable parse:json, it fails):
/// CLO
$ oc -n openshift-logging get clusterLogging -o yaml
apiVersion: v1
items:
- apiVersion: logging.openshift.io/v1
  kind: ClusterLogging
  metadata:
    creationTimestamp: "2024-04-29T10:10:58Z"
    generation: 5
    name: instance
    namespace: openshift-logging
    resourceVersion: "33891849"
    uid: 5948be65-c4b6-49cd-a08c-b2eb1939e6aa
  spec:
    collection:
      type: vector
    logStore:
      lokistack:
        name: logging-loki
      retentionPolicy:
        application:
          maxAge: 1d
        audit:
          maxAge: 1d
        infra:
          maxAge: 1d
      type: lokistack
    managementState: Managed
    visualization:
      type: ocp-console

/// CLF
$ oc -n openshift-logging get clusterlogforwarder instance -o yaml
apiVersion: logging.openshift.io/v1
kind: ClusterLogForwarder
metadata:
  creationTimestamp: "2024-06-27T13:40:46Z"
  generation: 3
  name: instance
  namespace: openshift-logging
  resourceVersion: "74640207"
  uid: a40e0c73-f6ea-4e76-918f-6cabb7d06b7c
spec:
  inputs:
  - application:
      namespaces:
      - test
    name: test
  pipelines:
  - inputRefs:
    - test
    name: enable-default-log-store
    outputRefs:
    - default
    parse: json
Having a log file with 4 JSON log lines containing `test{1...4}: test` keys/values that will be used later to easily identify the log lines read and sent or failing:
{"test1": "test", "timestamp": "2024-06-26T12:38:54.796Z", "loggerName": "audit-log",...}
{"test2": "test", "timestamp": "2024-06-26T12:38:54.796Z", "loggerName": "audit-log",...}
{"test3": "test", "timestamp": "2024-06-26T12:38:54.796Z", "loggerName": "audit-log",...}
{"test4": "test", "timestamp": "2024-06-26T12:38:54.796Z", "loggerName": "audit-log",...}
Identify the collector running in the same node that the application pod:
$ oc -n openshift-logging get pods -o wide -l component=collector |grep worker1.upishared
collector-pxjbn   1/1     Running   0          21h   10.131.3.191   worker1.upishared   <none>           <none>
Enter inside the collector pod and collect all the information sent to the sink `default`:
$ oc -n openshift-logging rsh collector-pxjbn
sh-5.1# vector tap --inputs-of output_default_test > /tmp/output_default_test
[tap] Pattern 'output_default_test' successfully matched.
Send these log lines to the standard output inside the test application pod pod as follows
$ oc -n test cp 1.tlog hello-node-595bfd9b77-wr7gs:/tmp/
$ oc -n test rsh hello-node-595bfd9b77-wr7gs
~ $ wc -l /tmp/1.log
4 /tmp/1.log
~ $ cat /tmp/1.log > /proc/1/fd/1
Stop the command inside vector collector using `ctrl + c` and check the number of lines sent to the sink `default`:
sh-5.1# wc -l /tmp/output_default_test
4 /tmp/output_default_test
Reviewing in the OpenShift Console > Observe > Logs, it's observed that the bigger log lines were not read and trying to send by the collector, but never ingested by Loki.
No error logs in the Loki side and in the collector side observed an error as below, but nothing pointing to the exact error:
$ oc -n openshift-logging logs collector-pxjbn
...
2024-06-28T13:55:35.875322Z ERROR sink{component_kind="sink" component_id=output_default_test component_type=loki}: vector::sinks::util::retries: Internal log [Non-retriable error; dropping the request.] has been suppressed 1 times.
2024-06-28T13:55:35.875450Z ERROR sink{component_kind="sink" component_id=output_default_test component_type=loki}: vector::sinks::util::retries: Non-retriable error; dropping the request. error=Server responded with an error: 400 Bad Request internal_log_rate_limit=true
2024-06-28T13:55:35.875523Z ERROR sink{component_kind="sink" component_id=output_default_test component_type=loki}: vector_common::internal_event::service: Internal log [Service call failed. No retries or retries exhausted.] has been suppressed 1 times.
2024-06-28T13:55:35.875615Z ERROR sink{component_kind="sink" component_id=output_default_test component_type=loki}: vector_common::internal_event::service: Service call failed. No retries or retries exhausted. error=Some(ServerError { code: 400 }) request_id=4 error_type="request_failed" stage="sending" internal_log_rate_limit=true
2024-06-28T13:55:35.875745Z ERROR sink{component_kind="sink" component_id=output_default_test component_type=loki}: vector_common::internal_event::component_events_dropped: Internal log [Events dropped] has been suppressed 1 times.
2024-06-28T13:55:35.875792Z ERROR sink{component_kind="sink" component_id=output_default_test component_type=loki}: vector_common::internal_event::component_events_dropped: Events dropped intentional=false count=4 reason="Service call failed. No retries or retries exhausted." internal_log_rate_limit=true
2024-06-28T14:02:54.574080Z ERROR sink{component_kind="sink" component_id=output_default_test component_type=loki}: vector::sinks::util::retries: Non-retriable error; dropping the request. error=Server responded with an error: 400 Bad Request internal_log_rate_limit=true
2024-06-28T14:02:54.574123Z ERROR sink{component_kind="sink" component_id=output_default_test component_type=loki}: vector_common::internal_event::service: Service call failed. No retries or retries exhausted. error=Some(ServerError { code: 400 }) request_id=5 error_type="request_failed" stage="sending" internal_log_rate_limit=true
2024-06-28T14:02:54.574138Z ERROR sink{component_kind="sink" component_id=output_default_test component_type=loki}: vector_common::internal_event::component_events_dropped: Events dropped intentional=false count=4 reason="Service call failed. No retries or retries exhausted." internal_log_rate_limit=true
Actual results:
The Vector collect shows that dropping some logs with `400 Bad Request` and in the Loki side not error observed.
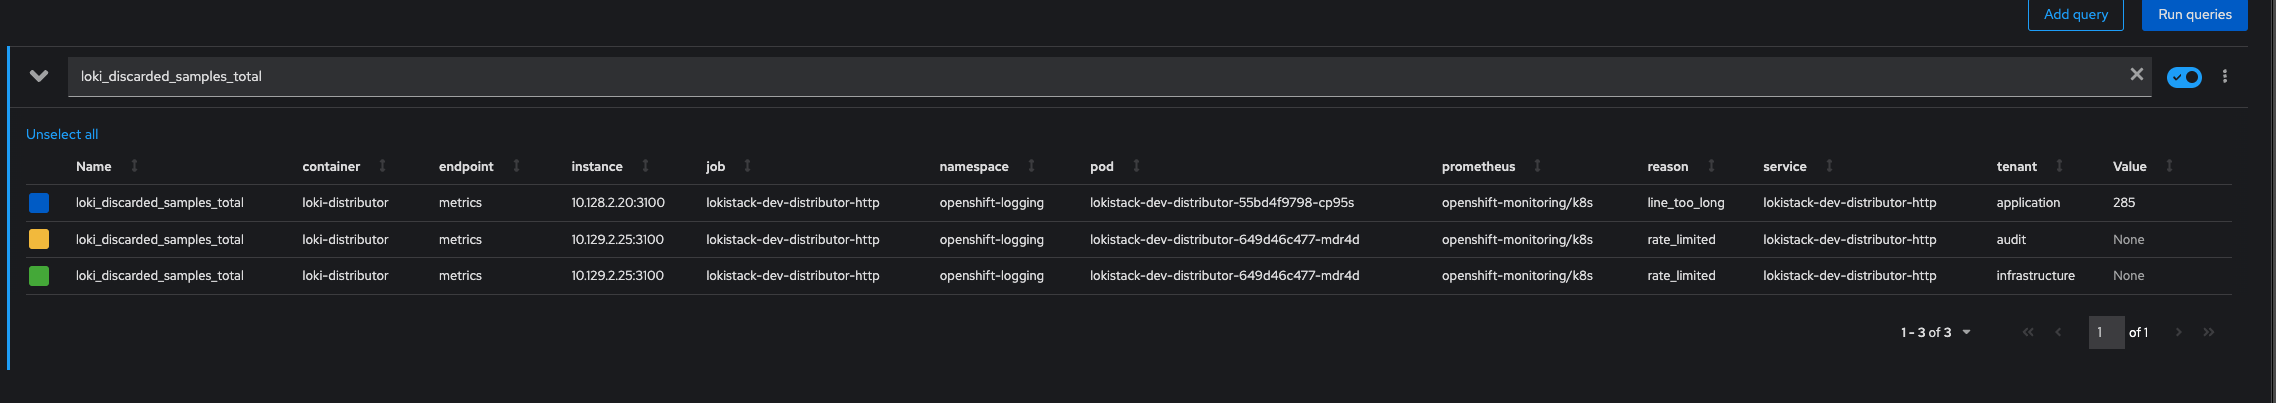
Not visible any error in the Loki pods logs. Only visible in the `loki_discarded_samples_total` that some logs are discarded with the reason `line_too_long`
Expected results:
- Loki ingests all the log lines or shows a clear error for the logs rejected being able to identify the log line rejected and the reason
- An alert is triggered related to when events are visible in the metric `loki_discarded_samples_total`
- Vector shows better what log lines are rejected for being able to trace them.
Additional info:
It's confirmed that the issue is related to `line_too_long` as observed in metrics `loki_discarded_samples_total`.
If the value of `spec.limits.gobal.ingestion.maxLineSize` is increased, the logs are ingested, but this value is recommended to don't change as impacting to the performance [0], could we know what's the exact performance impact in Loki beyond of the CPU and Memory?
[0] https://grafana.com/docs/loki/v2.9.x/operations/request-validation-rate-limits/#line_too_long
- clones
-
-
- Closed
-
- links to
-
 RHBA-2024:5123
Logging for Red Hat OpenShift - 5.8.11
RHBA-2024:5123
Logging for Red Hat OpenShift - 5.8.11
- mentioned on
