-
Bug
-
Resolution: Not a Bug
-
Normal
-
None
-
Logging 5.8.4
-
False
-
-
False
-
NEW
-
NEW
-
Bug Fix
-
-
-
Important
Description of problem:
Customer deployed the LokiStack to replace ElasticSearch. However due to missing resources on infrastructure nodes, two Loki Gateway (?) Pods stayed in "Pending", which was not noticed by the customer. However there was no alerting rule firing, alerting the customer about this, leading to no logs being stored.
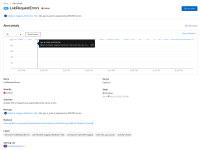
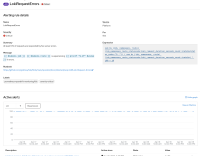
The alerting rules `LokiStackWriteRequestErrors` and `LokiRequestErrors` both return "100" (meaning 100% of write requests return with an error). An alert is triggered when the threshold is exceeded for more than 15 minutes. In the situation above there are breaks all the time within these 15 minutes, with the result that alerts are never triggered.
See screenshot attached.
The expectation would be that the rules fire in such a case when two Loki Pods stay "Pending" or are unavailable for other reasons.
Version-Release number of selected component (if applicable):
OpenShift Container Platform 4.12.46
cluster-logging.v5.8.4
How reproducible:
Always
Steps to Reproduce:
- Set up a cluster with OpenShift Logging 5.8.4
- Deploy OpenShift Logging 5.8 and create a LokiStack with "1x.small" sizing
- To simulate the issue, update the LokiStack object field ".spec.template.gateway.nodeSelector" with 'does-not-exist: "true"'. Delete the existing "gateway" ReplicaSet, this will lead to Pods being scheduled with the non-existent nodeSelectors. This will lead to the "gateway" Pods to stay in "Pending".
Actual results:
All writes are failing as expected. However `LokiStackWriteRequestErrors` and `LokiRequestErrors` alerting rules are not firing even after 15 minutes.
Observe that on the `LokiStackWriteRequestErrors` alerting rule we see a broken graph like the screenshots attached.
Expected results:
After 15 minutes `LokiStackWriteRequestErrors` and `LokiRequestErrors` alerting rules are firing
Additional info:
- Logging "must-gather" available in Support Case 03796198

