-
Bug
-
Resolution: Done-Errata
-
 Major
Major
-
Logging 5.8.0
-
False
-
-
False
-
NEW
-
VERIFIED
-
-
Known Issue
-
-
-
Log Storage - Sprint 246
-
Moderate
Description of problem:
it seems the application(console plugin? loki?) should dial [fd01:0:0:5::95]:9095 rather than fd01:0:0:5::95:9095
$oc logs lokistack-sample-ruler-0
...
Error while dialing: dial tcp: address fd01:0:0:5::95:9095: too many colons in address\""
level=warn ts=2023-10-23T10:16:59.074130143Z caller=logging.go:123 orgID=application msg="GET /prometheus/api/v1/rules (500) 841.674µs Response: \"{\\\"status\\\":\\\"error\\\",\\\"data\\\":null,\\\"errorType\\\":\\\"server_error\\\",\\\"error\\\":\\\"unable to retrieve rules from ruler fd01:0:0:5::95:9095: rpc error: code = Unavailable desc = connection error: desc = \\\\\\\"transport: Error while dialing: dial tcp: address fd01:0:0:5::95:9095: too many colons in address\\\\\\\"\\\"}\" ws: false; Accept: application/json; Accept-Encoding: gzip, deflate, br; Accept-Language: en-US,en;q=0.5; Forwarded: for=\"[2604:1380:4642:7e01:3d11:d50a:3b41:ef87]\";host=console-openshift-console.apps.anli623.qe.devcluster.openshift.com;proto=https; Referer: https://console-openshift-console.apps.anli623.qe.devcluster.openshift.com/monitoring/alerts?rowFilter-alert-state=firing&rowFilter-alert-source=platform; Sec-Fetch-Dest: empty; Sec-Fetch-Mode: cors; Sec-Fetch-Site: same-origin; User-Agent: Mozilla/5.0 (Macintosh; Intel Mac OS X 10.15; rv:109.0) Gecko/20100101 Firefox/115.0; X-Forwarded-For: 2604:1380:4642:7e01:3d11:d50a:3b41:ef87, fd01:0:0:4::2; X-Forwarded-Host: console-openshift-console.apps.anli623.qe.devcluster.openshift.com; X-Forwarded-Port: 443; X-Forwarded-Prefix: /api/logs/v1/application; X-Forwarded-Proto: https; X-Scope-Orgid: application; "
....
Version-Release number of selected component (if applicable):
4.14.0-0.nightly-2023-10-18-004928
How reproducible:
always
Steps to Reproduce:
1. Deploy lokistack on IPv6 single stack cluster
---
apiVersion: loki.grafana.com/v1
kind: LokiStack
metadata:
  name: lokistack-sample
spec:
  hashRing:
  memberlist:
    enableIPv6: true
  type: memberlist
  managementState: Managed
  size: 1x.demo
  storage:
    secret:
      name: s3-secret
      type: s3
  storageClassName: nfs
  tenants:
    mode: openshift-logging
  rules:
    enabled: true
    namespaceSelector:
      matchLabels:
        openshift.io/cluster-monitoring: "true"
    selector:
      matchLabels:
        openshift.io/cluster-monitoring: "true"
2. Create alertingrules for project my-app-1
oc new-project my-app-1
oc new-app https://raw.githubusercontent.com/openshift/verification-tests/master/testdata/logging/loggen/container_json_log_template.json
Note: Make sure to add openshift.io/cluster-monitoring: 'true' label on the app namespace.
apiVersion: loki.grafana.com/v1
kind: AlertingRule
metadata:
  labels:
    openshift.io/cluster-monitoring: 'true'
  name: dev-workload-alerts
  namespace: my-app-1
spec:
  groups:
    - interval: 1m
      name: devAppAlert
      rules:
        - alert: DevAppLogVolumeIsHigh
          annotations:
            description: My application has high amount of logs.
            summary: project "my-app-1" log volume is high.
          expr: >
            count_over_time({kubernetes_namespace_name="my-app-1"}[2m])
            > 10
          for: 5m
          labels:
            severity: info
            devApp: 'true'
3. Check the loki ruler pods
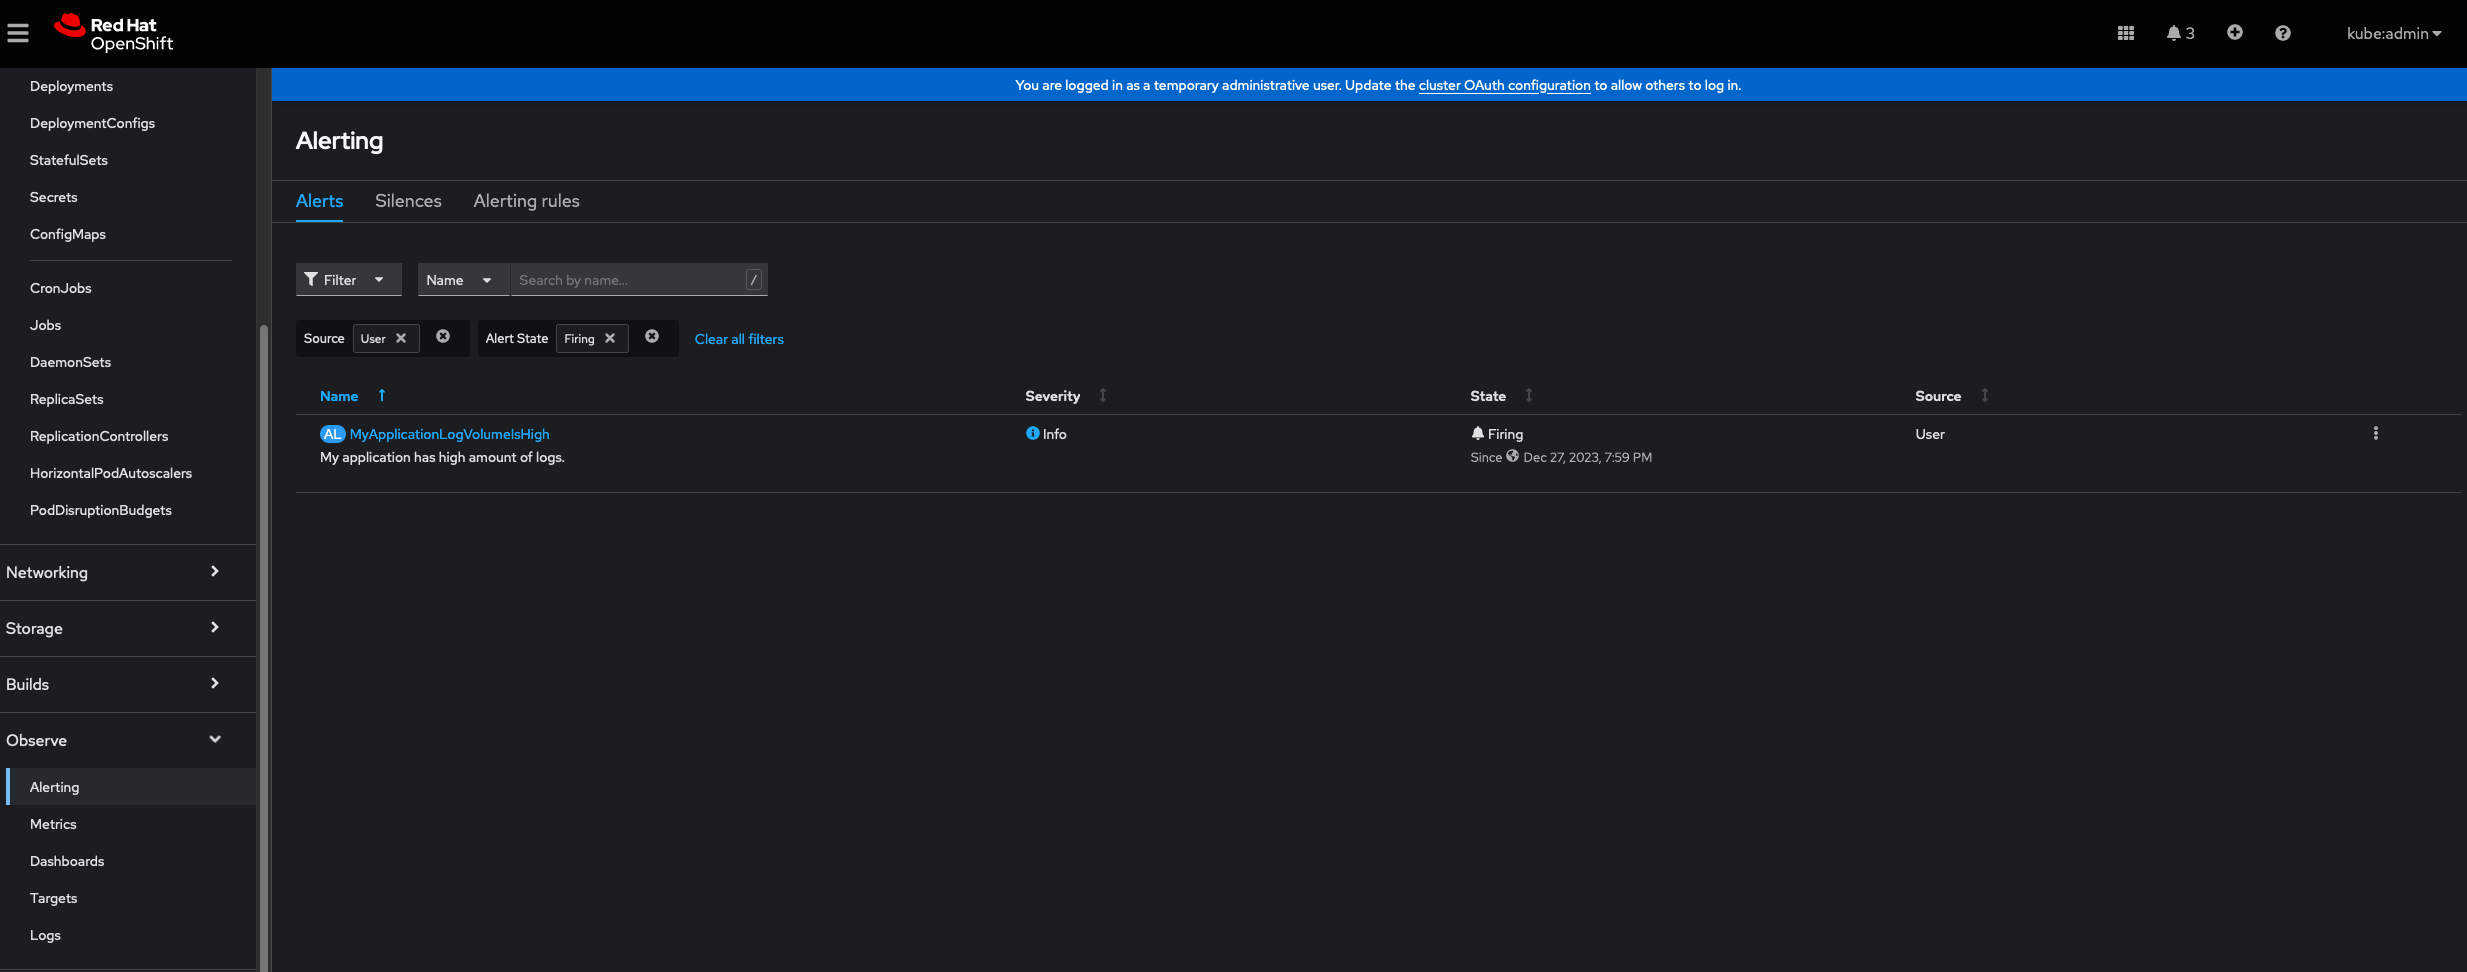
4. Check the alert rules in Webconsole
Expected results:
we can find dev-workload-alerts in Observe->Alerting->Alerting rules
Actual results:
we cannot see dev-workload-alerts.
oc logs lokistack-sample-ruler-0
....
Error while dialing: dial tcp: address fd01:0:0:5::95:9095: too many colons in address\""
level=warn ts=2023-10-23T10:16:59.074130143Z caller=logging.go:123 orgID=application msg="GET /prometheus/api/v1/rules (500) 841.674µs Response: \"{\\\"status\\\":\\\"error\\\",\\\"data\\\":null,\\\"errorType\\\":\\\"server_error\\\",\\\"error\\\":\\\"unable to retrieve rules from ruler fd01:0:0:5::95:9095: rpc error: code = Unavailable desc = connection error: desc = \\\\\\\"transport: Error while dialing: dial tcp: address fd01:0:0:5::95:9095: too many colons in address\\\\\\\"\\\"}\" ws: false; Accept: application/json; Accept-Encoding: gzip, deflate, br; Accept-Language: en-US,en;q=0.5; Forwarded: for=\"[2604:1380:4642:7e01:3d11:d50a:3b41:ef87]\";host=console-openshift-console.apps.anli623.qe.devcluster.openshift.com;proto=https; Referer: https://console-openshift-console.apps.anli623.qe.devcluster.openshift.com/monitoring/alerts?rowFilter-alert-state=firing&rowFilter-alert-source=platform; Sec-Fetch-Dest: empty; Sec-Fetch-Mode: cors; Sec-Fetch-Site: same-origin; User-Agent: Mozilla/5.0 (Macintosh; Intel Mac OS X 10.15; rv:109.0) Gecko/20100101 Firefox/115.0; X-Forwarded-For: 2604:1380:4642:7e01:3d11:d50a:3b41:ef87, fd01:0:0:4::2; X-Forwarded-Host: console-openshift-console.apps.anli623.qe.devcluster.openshift.com; X-Forwarded-Port: 443; X-Forwarded-Prefix: /api/logs/v1/application; X-Forwarded-Proto: https; X-Scope-Orgid: application; "
Additional info:
- clones
-
-
- Closed
-
- depends on
-
LOG-4872 Upgrade to Loki v2.9.3
-

- Closed
-
- links to
-
 RHBA-2024:125807
Logging Subsystem 5.7.10 - Red Hat OpenShift
RHBA-2024:125807
Logging Subsystem 5.7.10 - Red Hat OpenShift
