-
Bug
-
Resolution: Done-Errata
-
 Normal
-
Logging 5.7.5
-
False
-
-
False
-
NEW
-
VERIFIED
-
-
Bug Fix
-
-
Description of problem:
This PR:
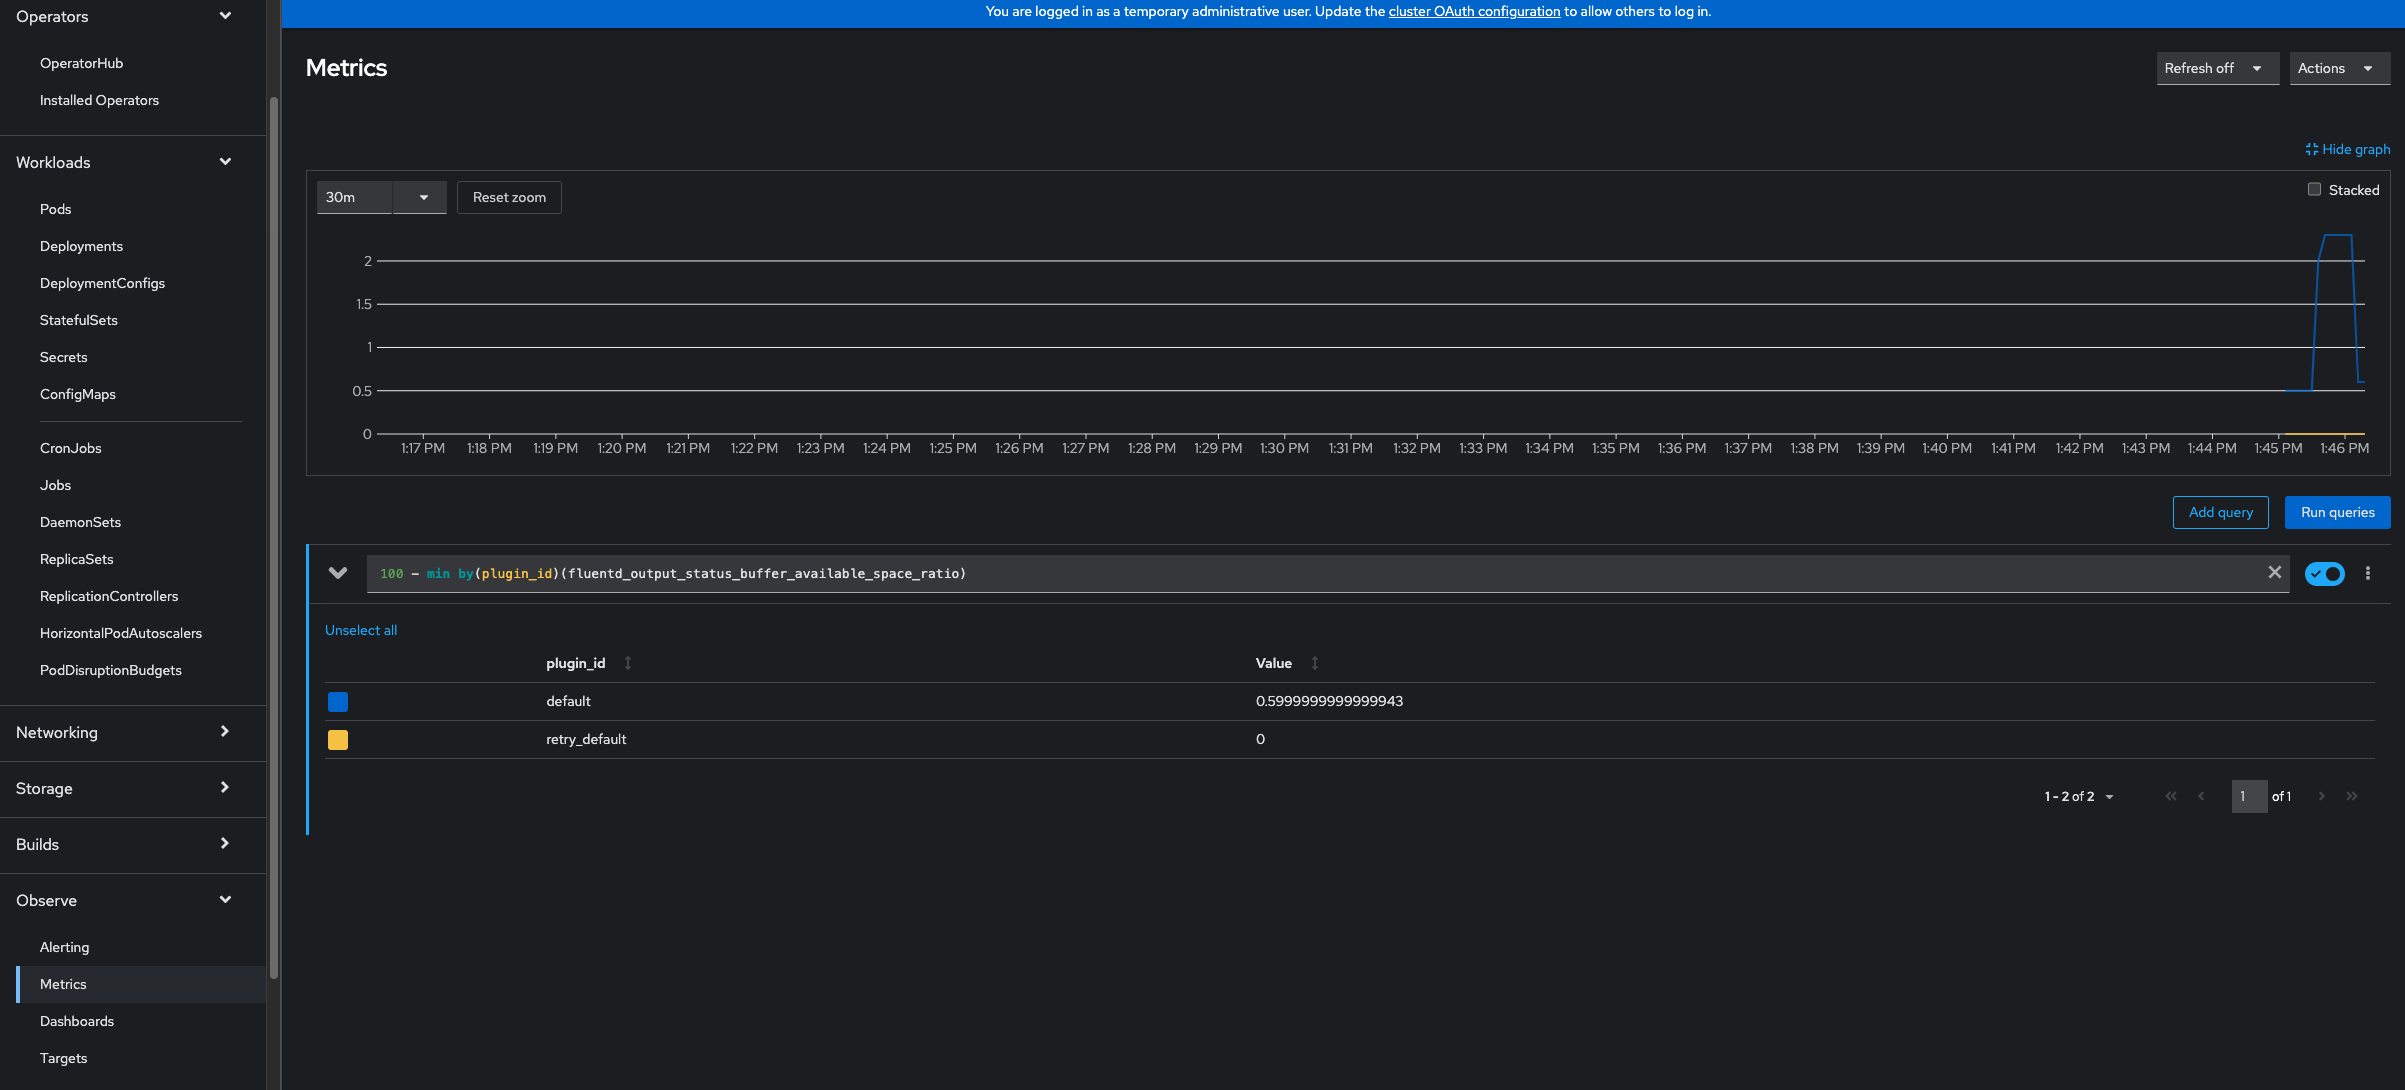
- fixes that "FluentD Buffer Availability" can show us the buffer usage based on the most highest usage value.
If "fluentd_output_status_buffer_available_space_ratio" metrics returns 100 and 50, "max" aggregation operator(current) always show us 0%(100-100) buffer usage, not 50%(100-50) buffer usage. It's not helpful to detect collector pods in high buffer usage. So it should change it to "min" aggregation operator for showing us values based on the most highest usage of buffer.
Version-Release number of selected component (if applicable):
OpenShift Logging 5.7+
How reproducible:
Always
Steps to Reproduce:
- Install OpenShift Logging 5.7+
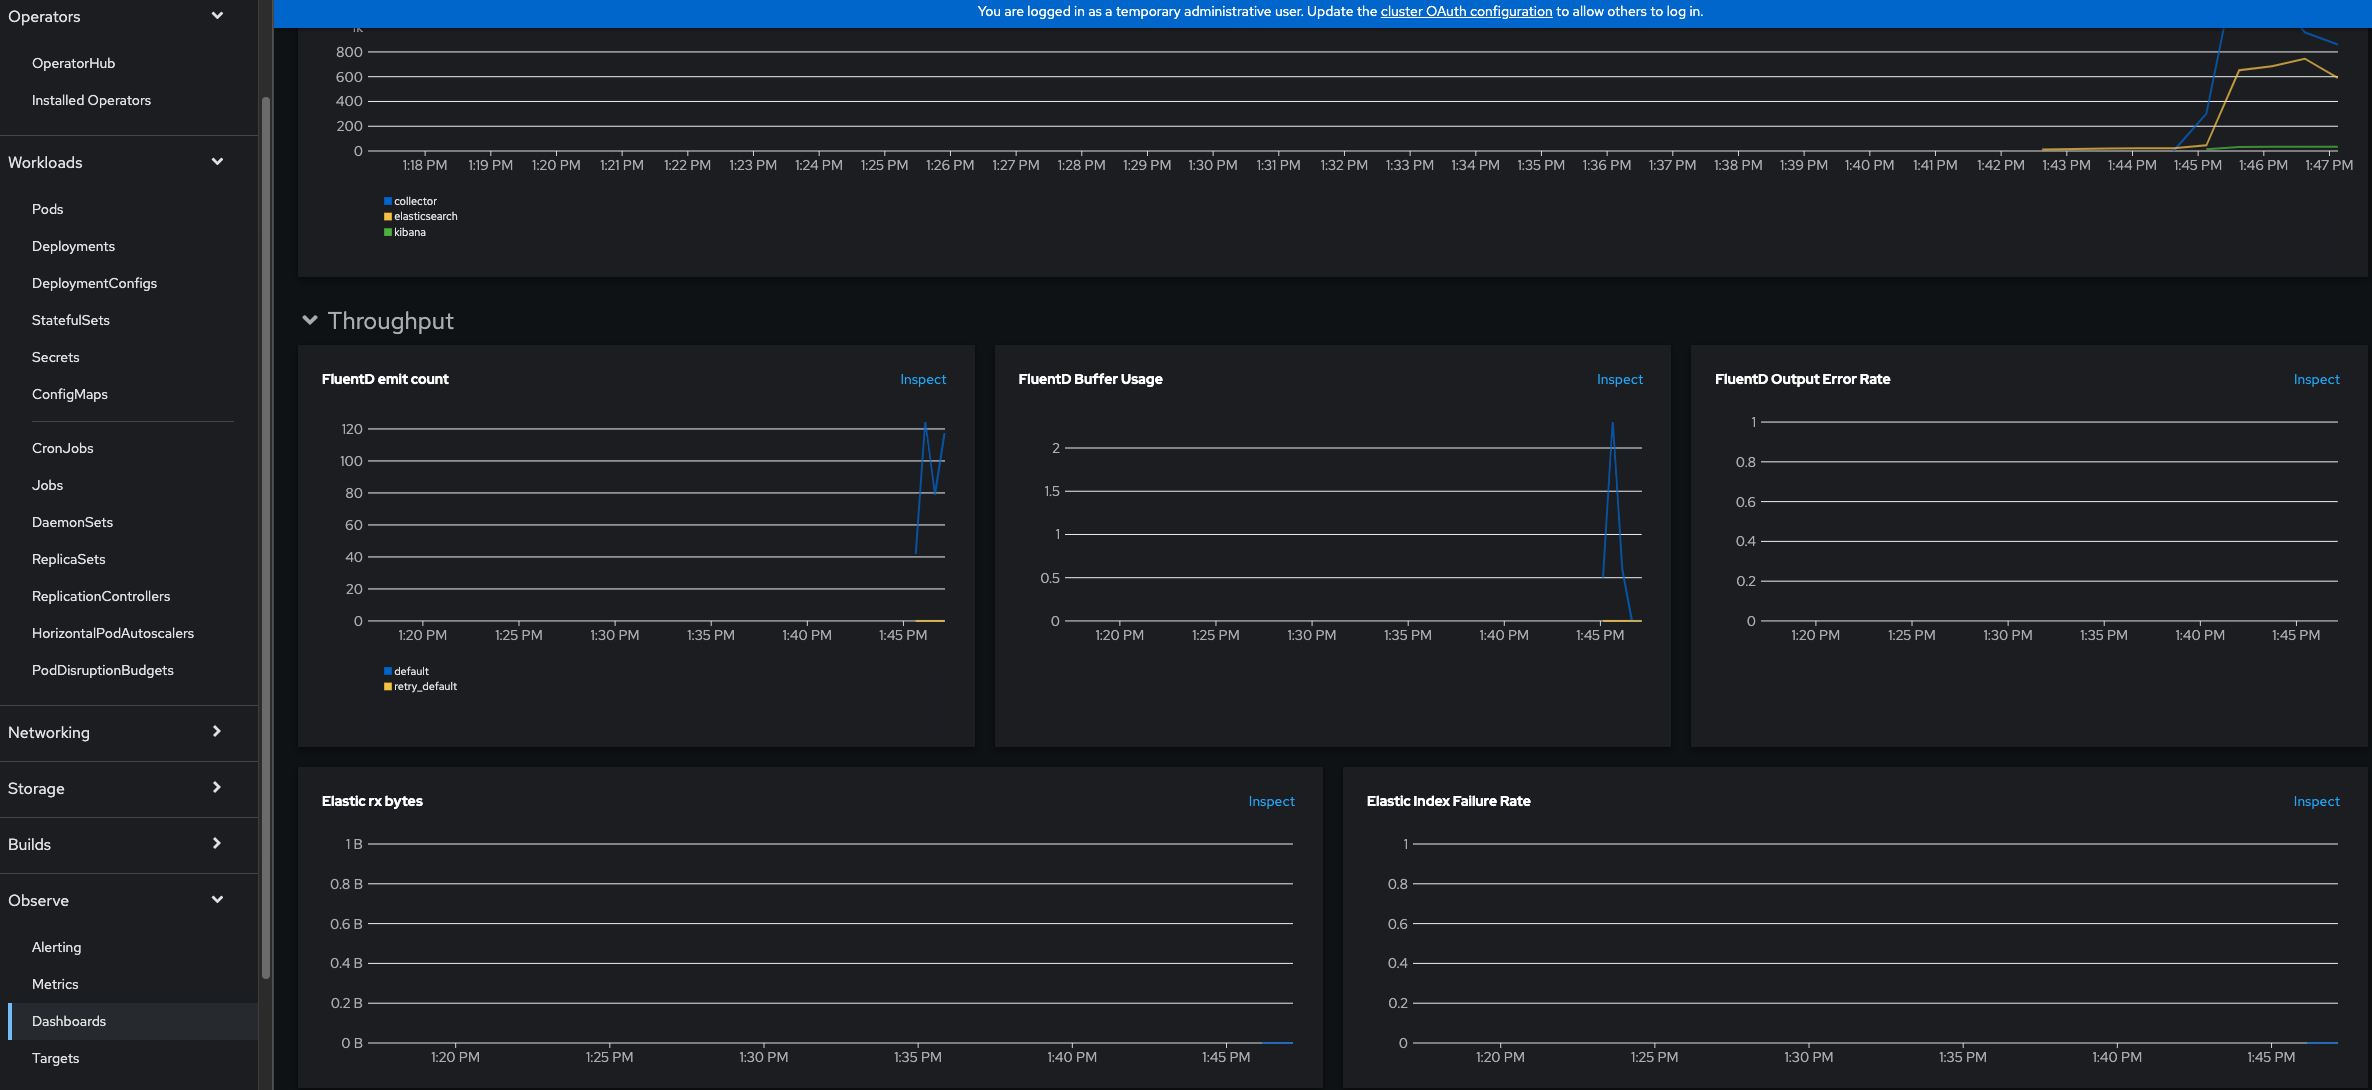
- Observe → Dashboards in web console
- On the Dashboards page, select OpenShift Logging from the Dashboard menu
- You can see "FluentD Buffer Availability" graph there
Actual results:
"FluentD Buffer Availability" show us usage of buffer based on "max" aggregator operator. As a result, it shows us the lower buffer usage than real usages.
And "FluedD Buffer Availability" shows us usage, not availalable value of the buffer. It's not matched with the title of graph.
Expected results:
- Title change: "FluedD Buffer Availability" -> "FluentD Buffer Usage"
- Fixes the promQL of the graph as follows.
100 - min by(plugin_id)(fluentd_output_status_buffer_available_space_ratio
Additional info:
Filed PR is here: https://github.com/openshift/cluster-logging-operator/pull/2172
- is cloned by
-
-
- Closed
-
-
-
- Closed
-
-
-
- Closed
-
- links to
-
 RHBA-2023:5530
Logging Subsystem 5.7.7 - Red Hat OpenShift
RHBA-2023:5530
Logging Subsystem 5.7.7 - Red Hat OpenShift
- mentioned on