-
Bug
-
Resolution: Done-Errata
-
 Major
Major
-
Logging 5.7.9
-
False
-
-
False
-
NEW
-
VERIFIED
-
-
Bug Fix
-
Proposed
-
-
-
Log Collection - Sprint 242, Log Collection - Sprint 243, Log Collection - Sprint 244, Log Collection - Sprint 245, Log Collection - Sprint 246
-
Important
Description of problem:
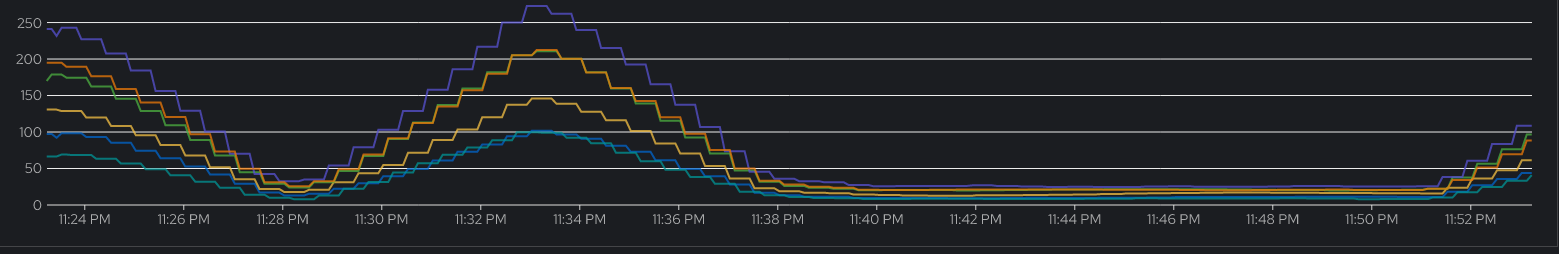
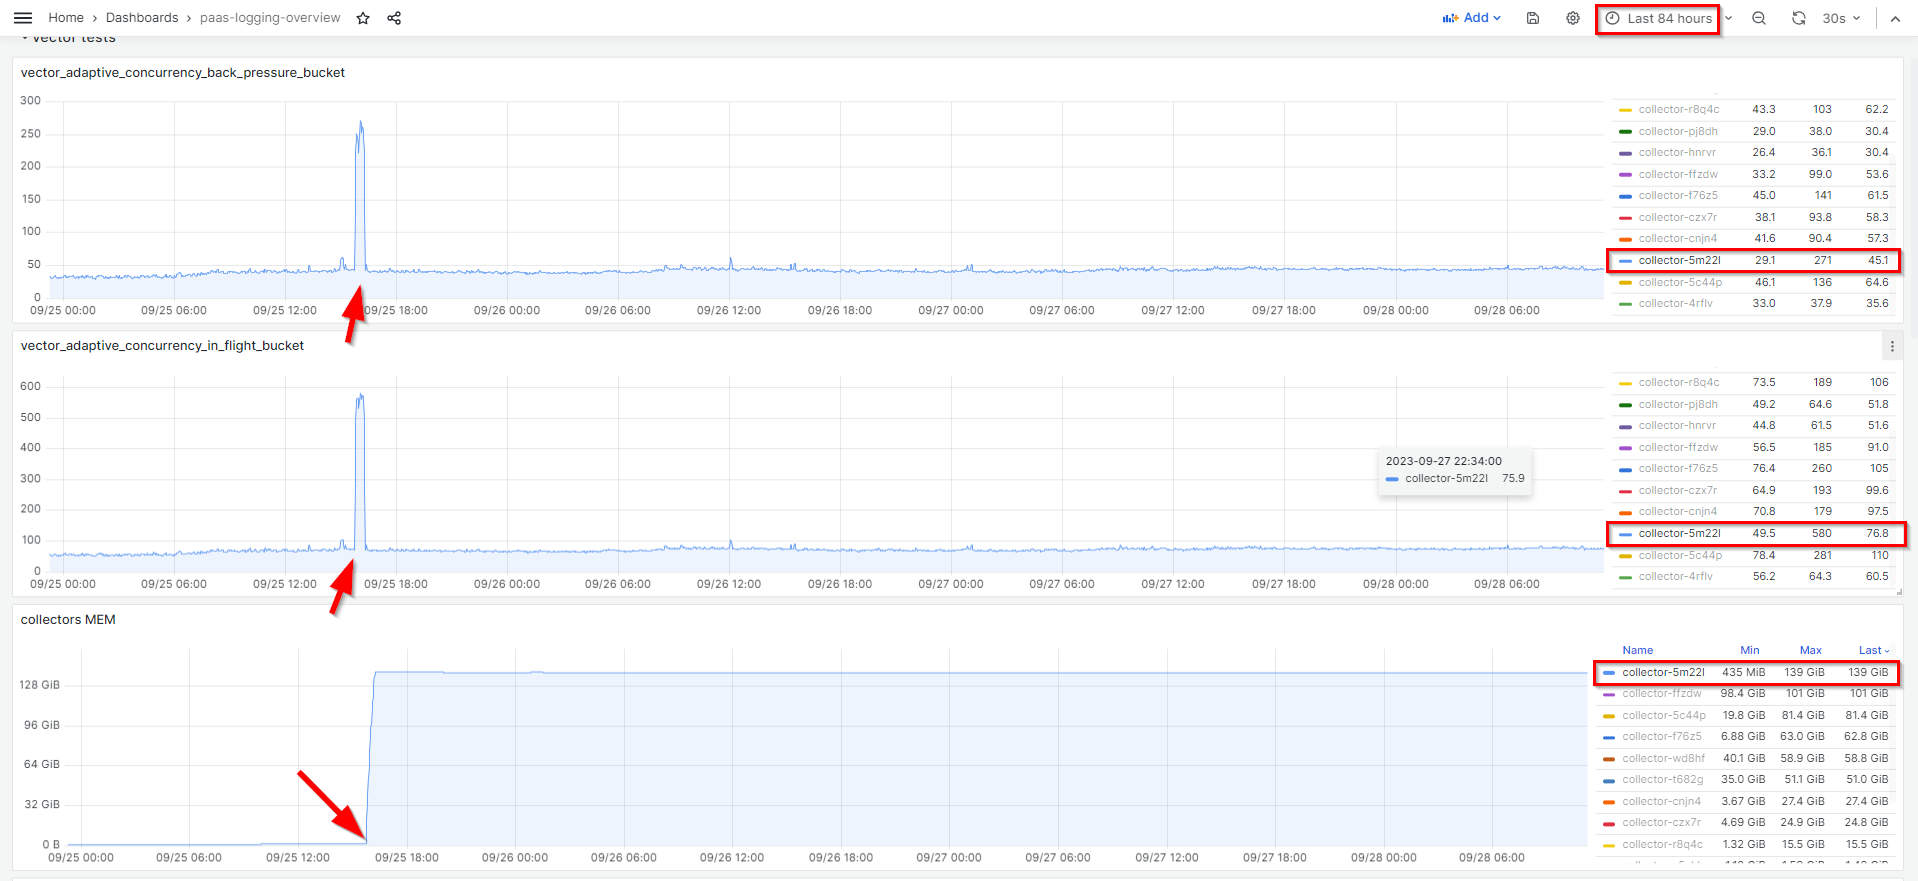
It's observed Vector pods using up 160G of memory.
    USER      PID      %CPU  %MEM  VSZ-MiB  RSS-MiB  TTY    STAT   START  TIME      COMMAND
    root      3626153  126   20.7  163472   160364   ?      -      Aug16  9323:42   /usr/bin/vector
It's needed to know:
- If the memory used by vector is legitim and the vector pod is not leaking memory. Then, is it posible to profile Vector's memory?
- where the memory is used and in case that related to some problems with delivering the logs to some output, is it possible to know how much memory is used for each output defined that justifies the usage of memory?
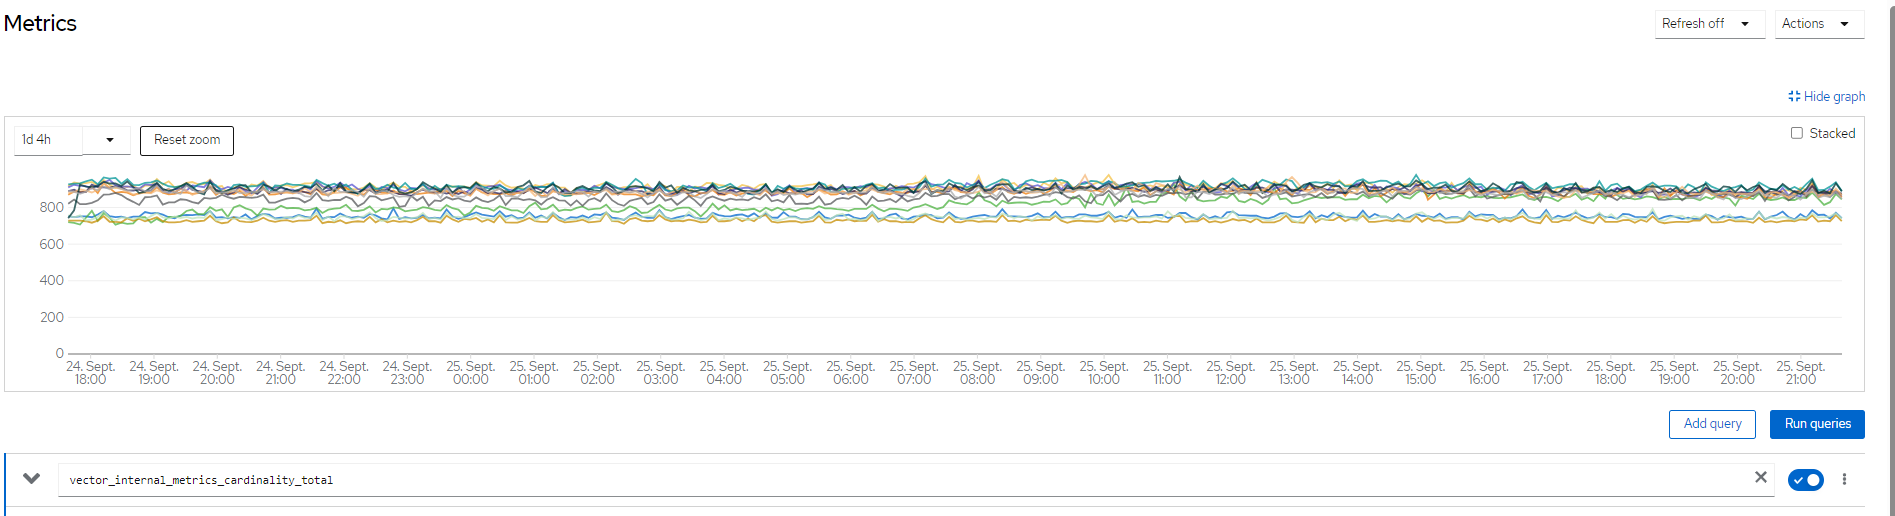
Currently, not more impacted by the vector_internal_metrics_cardinality_total since in Logging 5.7.6
Version-Release number of selected component (if applicable):
CLO 5.7.6
How reproducible:
Not able to reproduce in a lab with low load. But the objective is trying to get metrics and profile the memory to confirm where the memory is used and Vector is not leaking.
Steps to Reproduce:
N/A
Actual results:
Vector consuming until 160G without able to justify what part of Vector is using all this memory
Expected results:
Confirm that the memory used by Vector is legitim and indicate with metrics and/or memory profiling that Vector is working as expected and not suffering a leak
Additional info:
This is aligned also with RFE https://issues.redhat.com/browse/OBSDA-482 where it's needed to debug/troubleshoot Vector

- is related to
-
LOG-4597 Modify vector buffer and request to have fluentd parity
-

- Closed
-
- links to
-
 RHBA-2023:7718
Logging Subsystem 5.7.9 - Red Hat OpenShift
RHBA-2023:7718
Logging Subsystem 5.7.9 - Red Hat OpenShift
- mentioned on
