-
Bug
-
Resolution: Done
-
 Blocker
-
Logging 5.8.0
-
None
-
False
-
-
False
-
NEW
-
VERIFIED
-
Release Note Not Required
-
-
-
Log Storage - Sprint 239, Log Storage - Sprint 240
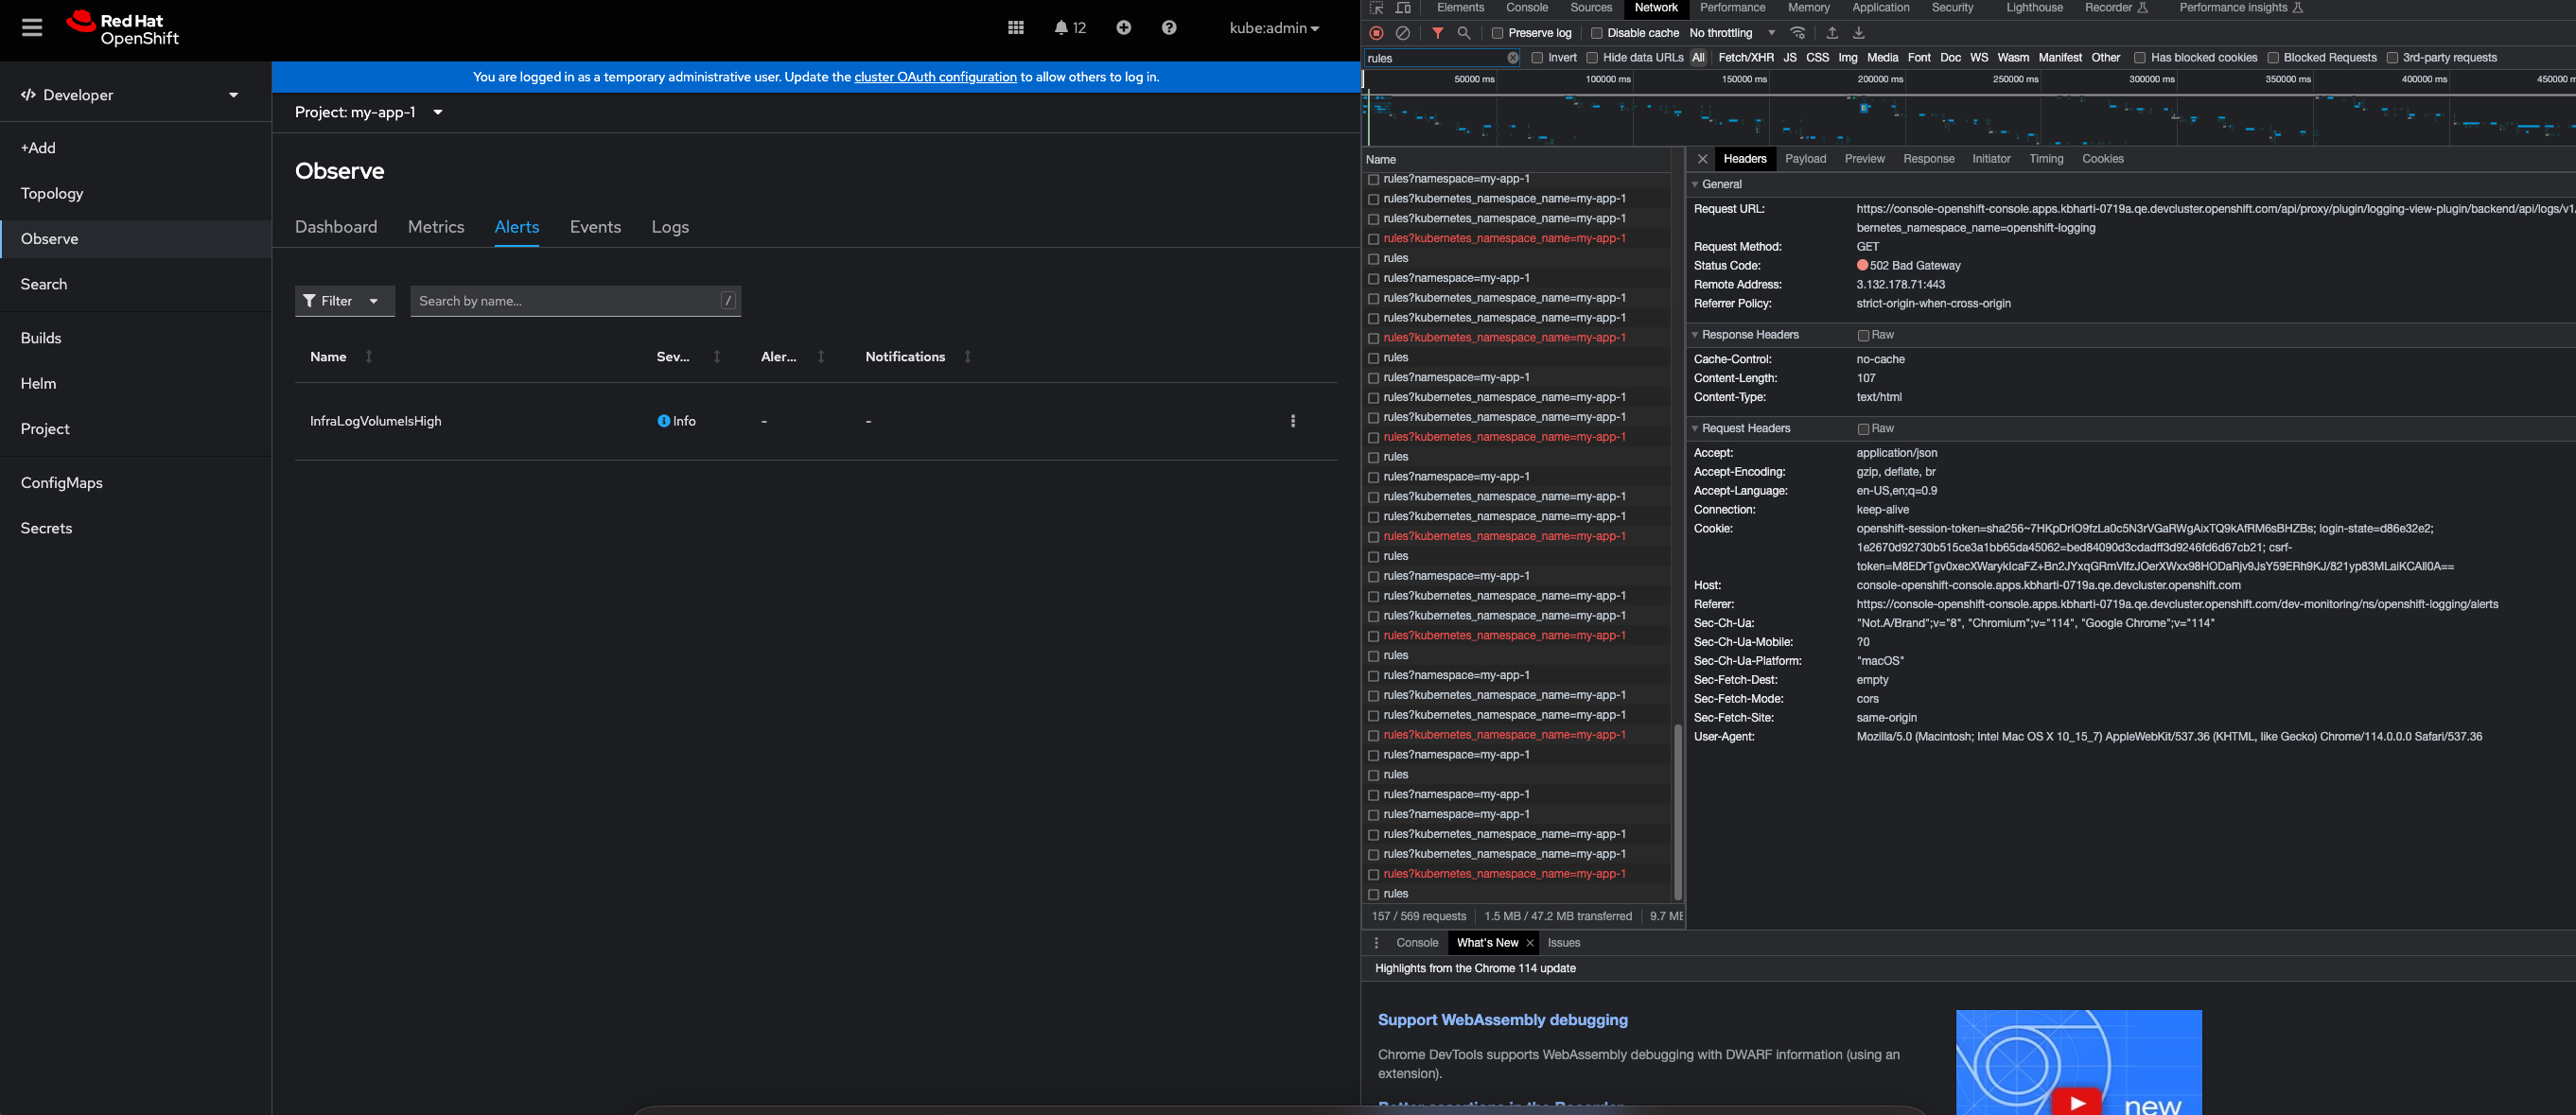
Description: rules API shows 502 gateway error when filtering rules for application tenant. No error seen for infrastructure and audit tenant.
Steps to reproduce:
1) Forward logs to default logStore loki
2) Create alerting rule for non-admin user
3) Patch console Deployment with the new image after making console operator in unmanaged state
3) Check alerts on dev-console
4) Add dev-alerts under logging-view-plugin deployment features.
Note: We need to build console image since PR for this change is not merged yet. This is pre-merge PR test.
OCP version: 4.14
Request Headers:
GET /api/proxy/plugin/logging-view-plugin/backend/api/logs/v1/application/prometheus/api/v1/rules?kubernetes_namespace_name=my-app-1 HTTP/1.1
Accept: application/json
Accept-Encoding: gzip, deflate, br
Accept-Language: en-US,en;q=0.9
Connection: keep-alive
Cookie: openshift-session-token=<token-value-hidden>; login-state=d86e32e2; 1e2670d92730b515ce3a1bb65da45062=bed84090d3cdadff3d9246fd6d67cb21; csrf-token=<token-value-hidden>
Host: console-openshift-console.apps.kbharti-0719a.qe.devcluster.openshift.com
Referer: https://console-openshift-console.apps.kbharti-0719a.qe.devcluster.openshift.com/dev-monitoring/ns/my-app-1/alerts
Sec-Fetch-Dest: empty
Sec-Fetch-Mode: cors
Sec-Fetch-Site: same-origin
User-Agent: Mozilla/5.0 (Macintosh; Intel Mac OS X 10_15_7) AppleWebKit/537.36 (KHTML, like Gecko) Chrome/114.0.0.0 Safari/537.36
sec-ch-ua: "Not.A/Brand";v="8", "Chromium";v="114", "Google Chrome";v="114"
sec-ch-ua-mobile: ?0
sec-ch-ua-platform: "macOS"
Response:
<html><body><h1>502 Bad Gateway</h1>
The server returned an invalid or incomplete response.
</body></html>
loki-gateway logs
$ oc logs lokistack-dev-gateway-d467f6b9d-6cvbd gateway -n openshift-logging
level=warn name=lokistack-gateway ts=2023-07-19T15:04:53.398419923Z caller=stdlib.go:105 caller=reverseproxy.go:665 msg="http: proxy error: context canceled"
level=warn name=lokistack-gateway ts=2023-07-19T15:04:53.398481306Z caller=instrumentation.go:33 request=lokistack-dev-gateway-d467f6b9d-6cvbd/FcTxkc2otY-000097 proto=HTTP/1.1 method=GET status=502 content= path=/api/logs/v1/infrastructure/prometheus/api/v1/rules duration=29.99191239s bytes=0
level=warn name=lokistack-gateway ts=2023-07-19T15:04:53.421599571Z caller=stdlib.go:105 caller=reverseproxy.go:665 msg="http: proxy error: context canceled"
level=warn name=lokistack-gateway ts=2023-07-19T15:04:53.421653794Z caller=instrumentation.go:33 request=lokistack-dev-gateway-d467f6b9d-6cvbd/FcTxkc2otY-000098 proto=HTTP/1.1 method=GET status=502 content= path=/api/logs/v1/audit/prometheus/api/v1/rules duration=29.996107525s bytes=0
level=warn name=lokistack-gateway ts=2023-07-19T15:04:53.946923628Z caller=stdlib.go:105 caller=reverseproxy.go:665 msg="http: proxy error: context canceled"
level=warn name=lokistack-gateway ts=2023-07-19T15:04:53.946971189Z caller=instrumentation.go:33 request=lokistack-dev-gateway-d467f6b9d-6cvbd/FcTxkc2otY-000103 proto=HTTP/1.1 method=GET status=502 content= path=/api/logs/v1/application/prometheus/api/v1/rules duration=29.995835393s bytes=0
level=warn name=lokistack-gateway ts=2023-07-19T15:05:01.30366224Z caller=stdlib.go:105 caller=reverseproxy.go:665 msg="http: proxy error: context canceled"
level=warn name=lokistack-gateway ts=2023-07-19T15:05:01.30371234Z caller=instrumentation.go:33 request=lokistack-dev-gateway-d467f6b9d-6cvbd/FcTxkc2otY-000154 proto=HTTP/1.1 method=GET status=502 content= path=/api/logs/v1/audit/prometheus/api/v1/rules duration=29.994299426s bytes=0
How reproducible: Always
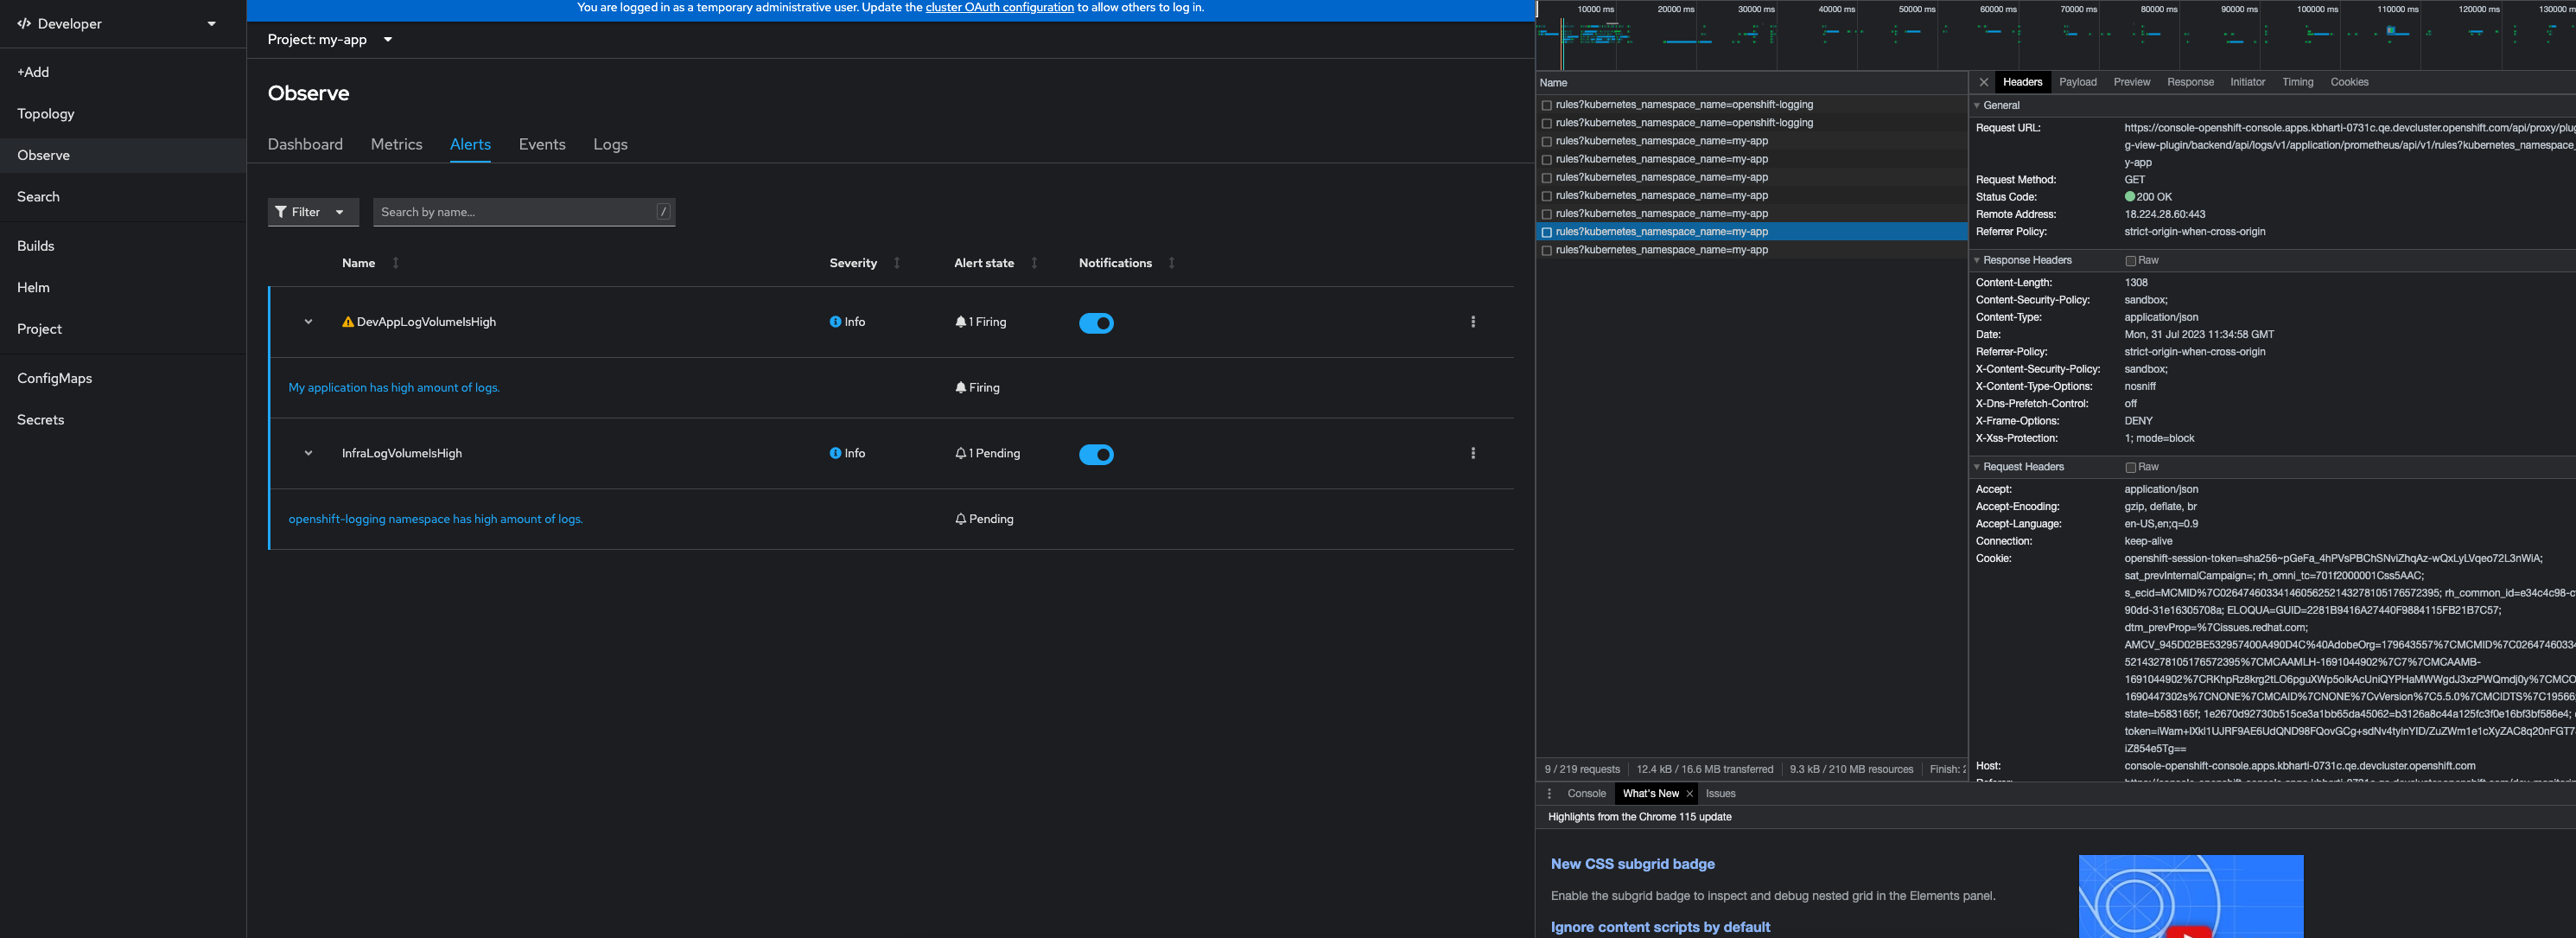
Expected result: dev console should display alerts for app tenant
Actual result: 502 errors on filtering rules for app tenant