-
Bug
-
Resolution: Done
-
 Normal
-
Logging 5.7.0
-
False
-
-
False
-
NEW
-
VERIFIED
-
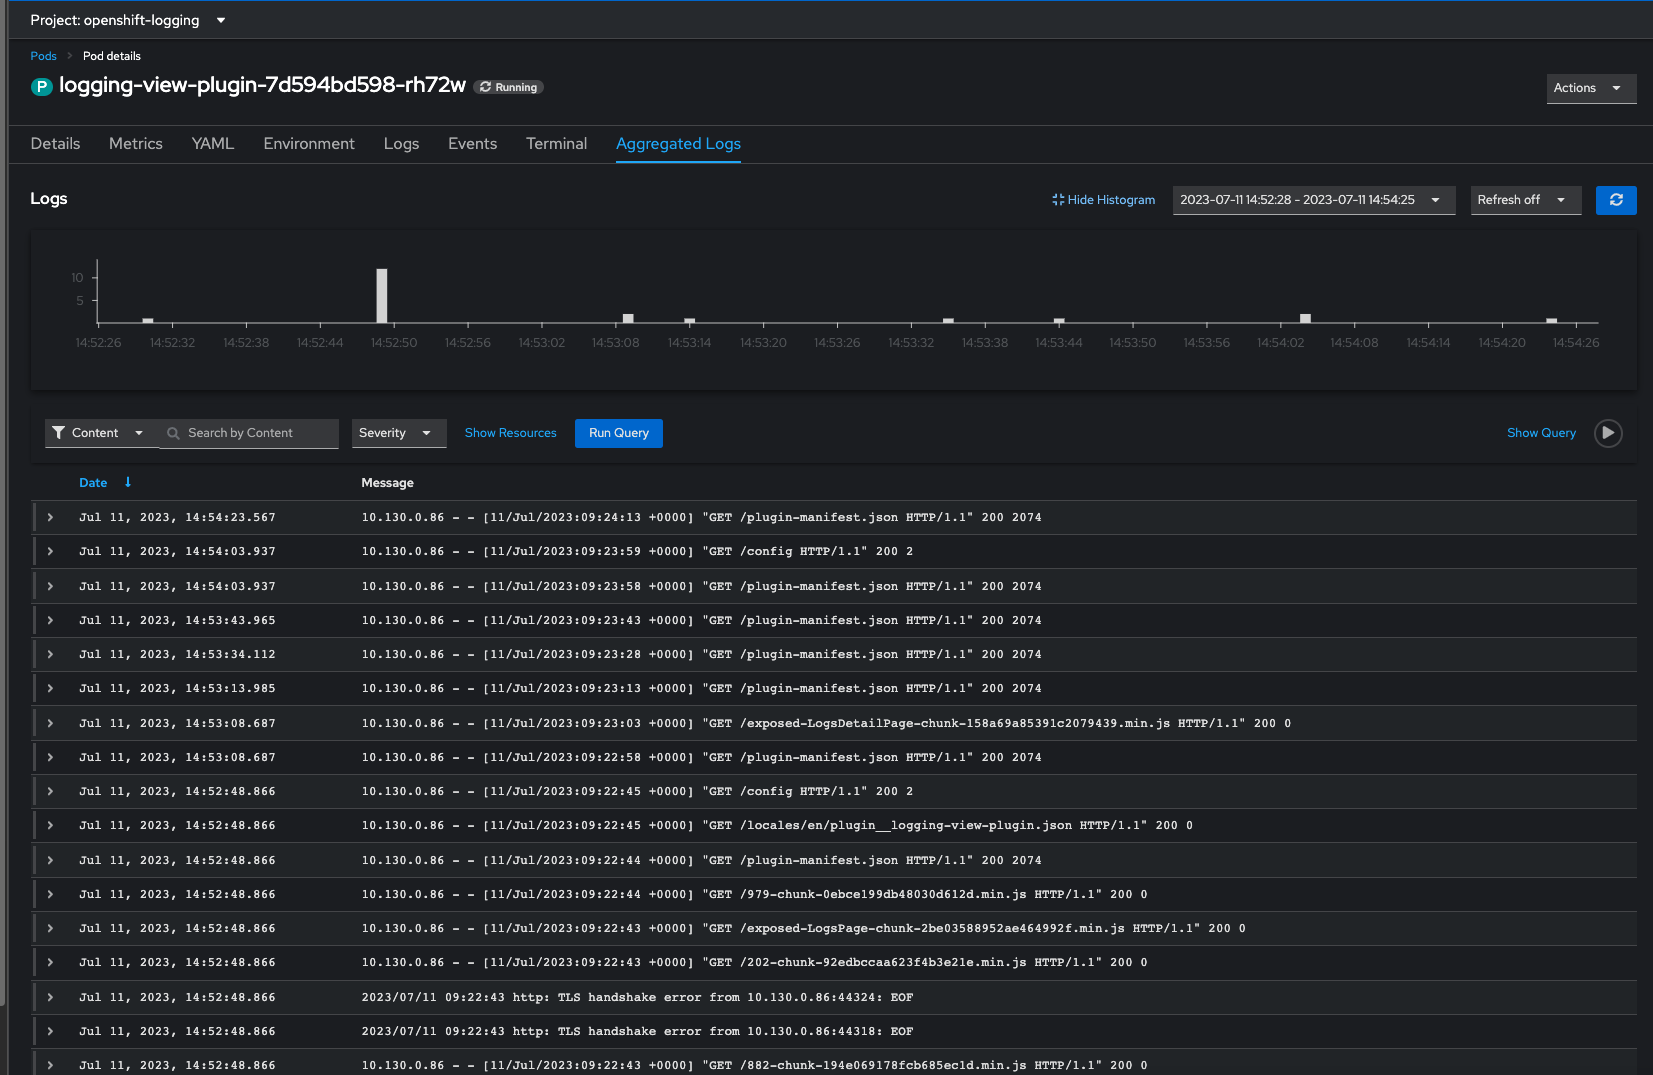
Before this update, selecting a time range by dragging over the histogram didn't work on the aggregated logs view inside the pod detail. After this update the time range can be selected by dragging on the histogram in this view.
-
Bug Fix
-
-
Description of problem:
On the Aggregated Logs page inside a Pod details tab, Custom time range is not getting updated if select with cursor move on the histogram.
Version-Release number of selected component (if applicable):
Logging: 5.7
How reproducible:
Always
Steps to reproduce:
1. Deploy OpenShift Logging 5.7 with Loki/Vector stack and enable Logging console plugin according to https://docs.openshift.com/container-platform/4.12/logging/cluster-logging-loki.html#logging-loki-deploy_cluster-logging-loki
2. Deploy some application pod
3. Search logs from OpenShift webconsole's Admin > Observe > Logs
4. Click on the "Show Resource", then click on the link to pods page
5. Try the cursor move option to select custom time range on the Histogram
Actual results:
Custom time is not update
Expected results:
Custom time range is updated
- is cloned by
-
-
- Closed
-
- links to
- mentioned on