-
Bug
-
Resolution: Cannot Reproduce
-
 Normal
-
Logging 5.2.z, Logging 5.3.z, Logging 5.4.z
-
False
-
-
False
-
NEW
-
NEW
-
-
Logging (LogExp) - Sprint 218, Logging (LogExp) - Sprint 219, Logging (LogExp) - Sprint 220, Log Storage - Sprint 221, Log Storage - Sprint 222, Log Storage - Sprint 223, Log Storage - Sprint 224, Log Storage - Sprint 225
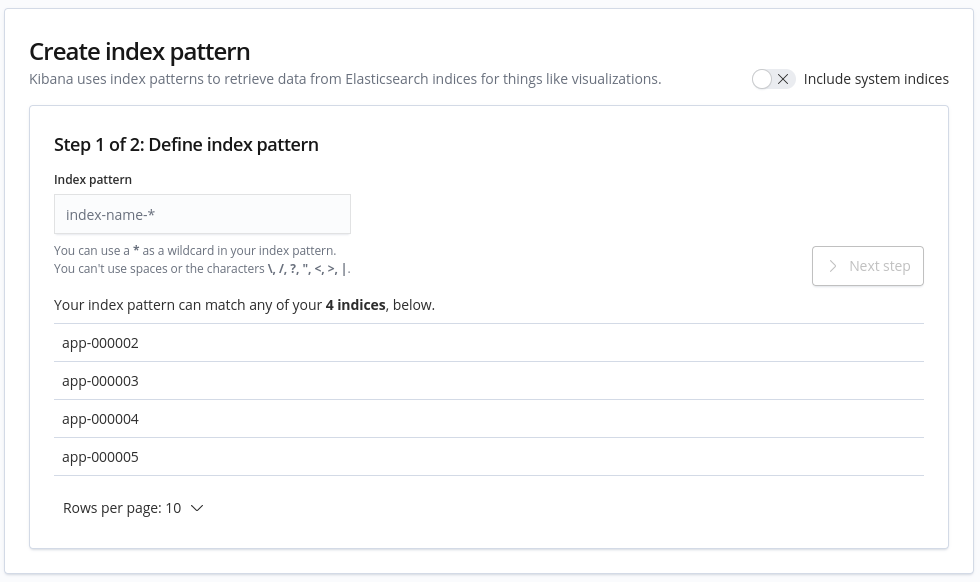
Sometimes normal users can't create index patterns in Kibana when it's projects' logs are collected to ES.
In ES:
$ oc exec elasticsearch-cdm-myprinc6-1-c7c4cdd68-7nwjd -- es_util '--query=app*/_search?pretty&size=0' -d'{"aggs" : {"exists_field_kubernetes" : {"filter": {"exists": {"field":"kubernetes"}},"aggs" : {"distinct_project_name" : {"terms" : {"field" : "kubernetes.namespace_name"}}}}}}'
Defaulted container "elasticsearch" out of: elasticsearch, proxy
{
  "took" : 51,
  "timed_out" : false,
  "_shards" : {
    "total" : 3,
    "successful" : 3,
    "skipped" : 0,
    "failed" : 0
  },
  "hits" : {
    "total" : 15602,
    "max_score" : 0.0,
    "hits" : [ ]
  },
  "aggregations" : {
    "exists_field_kubernetes" : {
      "doc_count" : 15602,
      "distinct_project_name" : {
        "doc_count_error_upper_bound" : 0,
        "sum_other_doc_count" : 0,
        "buckets" : [
          {
            "key" : "qitang",
            "doc_count" : 7321
          },
          {
            "key" : "logging-upg-prep-1",
            "doc_count" : 3892
          },
          {
            "key" : "logging-upg-prep-share",
            "doc_count" : 3883
          },
          {
            "key" : "test-project",
            "doc_count" : 505
          },
          {
            "key" : "jso5l",
            "doc_count" : 1
          }
        ]
      }
    }
  }
}
For testuser-48/testuser-16:
$ oc whoami
testuser-48
$ oc get projects
NAME           DISPLAY NAME   STATUS
test-project                  Active

[root@hpe-dl380pgen8-02-vm-13 ~]# oc whoami
testuser-16
[root@hpe-dl380pgen8-02-vm-13 ~]# oc get projects
NAME                     DISPLAY NAME   STATUS
logging-upg-prep-1                      Active
logging-upg-prep-share                  Active
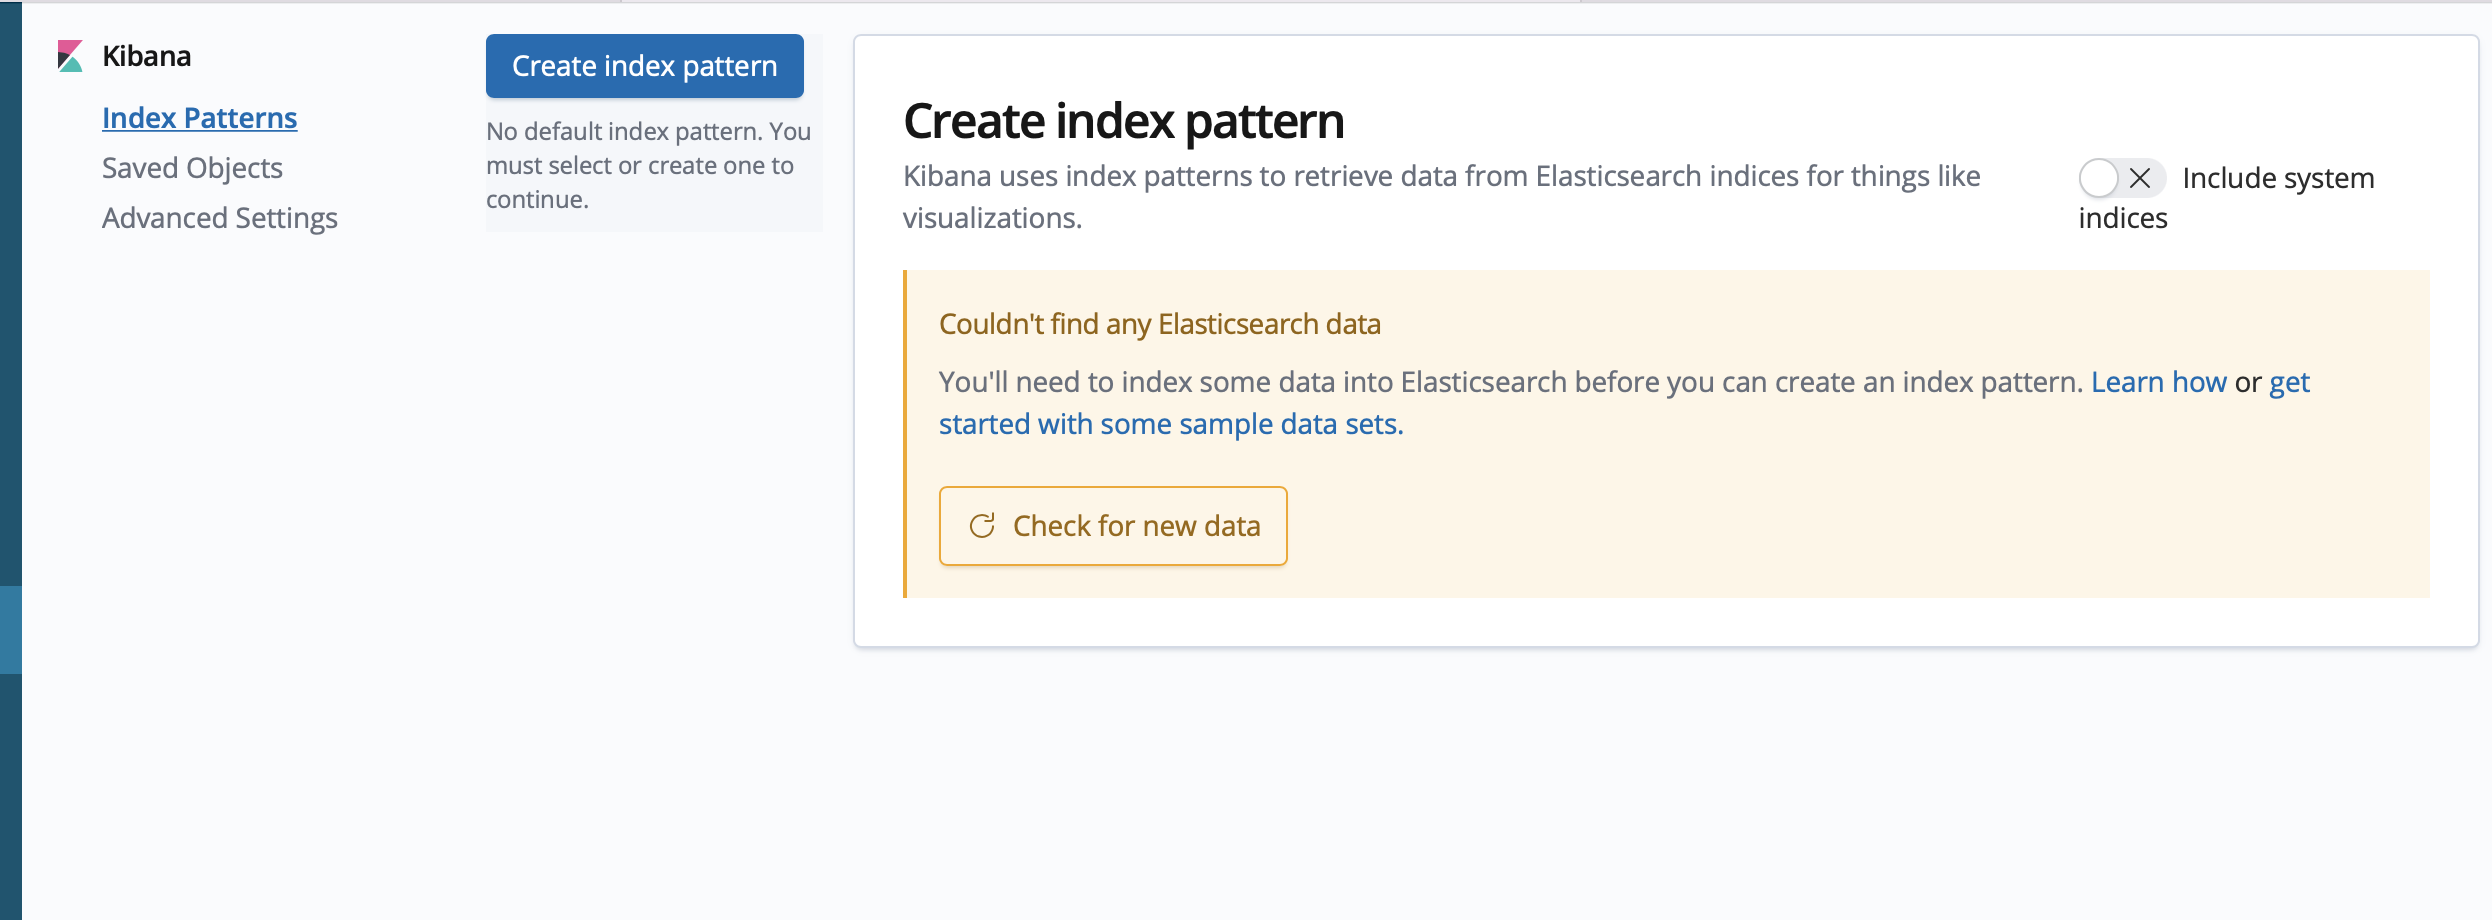
However, log into Kibana console with testuser-48/testuser-16, when creating index patterns, the page shows:
Couldn't find any Elasticsearch data
In ES, the index .kibana_xxxx is created:
$ oc exec elasticsearch-cdm-myprinc6-1-c7c4cdd68-7nwjd -- indices
Defaulted container "elasticsearch" out of: elasticsearch, proxy
Thu Apr 28 06:32:28 UTC 2022
health status index                           uuid                   pri rep docs.count docs.deleted store.size pri.store.size
green  open   .kibana_2090532596_testuser48_1 KUZfuKPuSmO5KzahrqcWJw   1   1          1            0          0              0
green  open   app-000001                      pvJNP9aLT7y0U-KcwYO0qQ   3   1      14469            0         17              9
green  open   infra-000001                    Lbq10pJMTwuPf23pCBygAg   3   1     151359            0        204            102
green  open   .security                       J_zje2pmRfuL5B9WTqbTkA   1   1          6            0          0              0
green  open   .kibana_1                       wr55MTkESv6SXEcgae3NNQ   1   1          0            0          0              0
green  open   .kibana_2090532501_testuser16_1 6iG_xoiwRyqnrcqsX4R6VQ   1   1          1            0          0              0
green  open   audit-000001                    yt5MuiUgQ3Gd5wRc227qkw   3   1          0            0          0              0
$ oc exec elasticsearch-cdm-myprinc6-1-c7c4cdd68-7nwjd -- es_util --query=.kibana_2090532596_testuser48_1/_search?pretty
Defaulted container "elasticsearch" out of: elasticsearch, proxy
{
  "took" : 4,
  "timed_out" : false,
  "_shards" : {
    "total" : 1,
    "successful" : 1,
    "skipped" : 0,
    "failed" : 0
  },
  "hits" : {
    "total" : 1,
    "max_score" : 1.0,
    "hits" : [
      {
        "_index" : ".kibana_2090532596_testuser48_1",
        "_type" : "doc",
        "_id" : "config:6.8.1",
        "_score" : 1.0,
        "_source" : {
          "config" : {
            "buildNum" : 20385
          },
          "type" : "config",
          "updated_at" : "2022-04-28T06:03:27.683Z"
        }
      }
    ]
  }
}
$ oc exec elasticsearch-cdm-myprinc6-1-c7c4cdd68-7nwjd -- es_util --query=.kibana_2090532501_testuser16_1/_search?pretty
Defaulted container "elasticsearch" out of: elasticsearch, proxy
{
  "took" : 18,
  "timed_out" : false,
  "_shards" : {
    "total" : 1,
    "successful" : 1,
    "skipped" : 0,
    "failed" : 0
  },
  "hits" : {
    "total" : 1,
    "max_score" : 1.0,
    "hits" : [
      {
        "_index" : ".kibana_2090532501_testuser16_1",
        "_type" : "doc",
        "_id" : "config:6.8.1",
        "_score" : 1.0,
        "_source" : {
          "config" : {
            "buildNum" : 20385
          },
          "type" : "config",
          "updated_at" : "2022-04-28T05:45:58.937Z"
        }
      }
    ]
  }
}
This issue is not 100% reproducible, I recently saw it 3 times on 5.2, 5.3 and 5.4.
Must-gather: http://file.apac.redhat.com/~qitang/must-gather/must-gather.tar.gz