-
Bug
-
Resolution: Done
-
Major
-
Logging 5.2.2
-
False
-
False
-
NEW
-
VERIFIED
-
-
-
Logging (Core) - Sprint 211, Logging (Core) - Sprint 216, Logging (Core) - Sprint 217
This was originally opened as a bug against Monitoring: https://bugzilla.redhat.com/show_bug.cgi?id=2021342
Monitoring team moved it to Logging component but as the issue is on Logging 5.2 I am moving this to JIRA. Initial problem description reported below, followed by copies of comments from Monitoring team.
----------
OpenShift 4.7.34
Openshift Logging: cluster-logging.5.2.2-21
Description of problem:
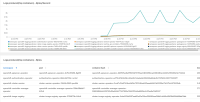
Getting message, "Prometheus could not scrape fluentd for more than 10m."
How reproducible:
Unconfirmed
Additional info:
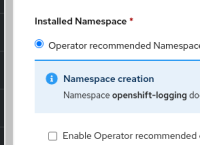
Customer set label openshift.io/cluster-monitoring: "true" set but still that error is not clearing.
The prometheus pods are noting this error on repeat:
2021-10-31T03:05:06.385693354Z level=error ts=2021-10-31T03:05:06.385Z caller=klog.go:96 component=k8s_client_runtime func=ErrorDepth msg="github.com/prometheus/prometheus/discovery/kubernetes/kubernetes.go:428: Failed to watch *v1.Pod: failed to list *v1.Pod: pods is forbidden: User \"system:serviceaccount:openshift-monitoring:prometheus-k8s\" cannot list resource \"pods\" in API group \"\" in the namespace \"openshift-logging\""
2021-10-31T03:05:08.607296440Z level=error ts=2021-10-31T03:05:08.607Z caller=klog.go:96 component=k8s_client_runtime func=ErrorDepth msg="github.com/prometheus/prometheus/discovery/kubernetes/kubernetes.go:427: Failed to watch *v1.Service: failed to list *v1.Service: services is forbidden: User \"system:serviceaccount:openshift-monitoring:prometheus-k8s\" cannot list resource \"services\" in API group \"\" in the namespace \"openshift-logging\""
2021-10-31T03:05:31.197590776Z level=error ts=2021-10-31T03:05:31.197Z caller=klog.go:96 component=k8s_client_runtime func=ErrorDepth msg="github.com/prometheus/prometheus/discovery/kubernetes/kubernetes.go:426: Failed to watch *v1.Endpoints: failed to list *v1.Endpoints: endpoints is forbidden: User \"system:serviceaccount:openshift-monitoring:prometheus-k8s\" cannot list resource \"endpoints\" in API group \"\" in the namespace \"openshift-logging\""
We found a similar bug from an older version:
https://bugzilla.redhat.com/show_bug.cgi?id=1774907
Using diagnostic steps from that bug:
- token=`oc -n openshift-monitoring sa get-token prometheus-k8s`
- oc auth can-i list endpoints -n openshift-logging --token $token
- oc auth can-i list endpoints -n openshift-logging --token $token
- oc auth can-i list endpoints -n openshift-logging --token $token
- oc auth can-i list endpoints -n openshift-logging --token $token
- oc auth can-i list endpoints -n openshift-logging --token $token
- oc auth can-i list endpoints -n openshift-logging --token $token
These all result "no". I suspect something has failed to set the proper rolebindings for prometheus-k8s. Are there roles that should be added? Can they be added manually?
----------
Arunprasad Rajkumar 2021-11-09 06:35:35 UTC
Other cluster operators(e.g. cluster-etcd-operator] defines explicit role[1] bindings[2] to the `prometheus-k8s` service account. You may need to follow the same.
But I'm wondering why it was not done from cluster-logging operator!
[1] https://github.com/openshift/cluster-etcd-operator/blob/master/manifests/0000_90_etcd-operator_01_prometheusrole.yaml
[2] https://github.com/openshift/cluster-etcd-operator/blob/master/manifests/0000_90_etcd-operator_02_prometheusrolebinding.yaml
----------
Arunprasad Rajkumar 2021-11-09 07:52:24 UTC
It seems cluster-logging-operator has the necessary role[1] binding[2] to the `prometheus-k8s` service account.
[1] https://github.com/openshift/cluster-logging-operator/blob/release-4.7/manifests/4.7/0100_clusterroles.yaml
[2] https://github.com/openshift/cluster-logging-operator/blob/release-4.7/manifests/4.7/0110_clusterrolebindings.yaml

