-
Story
-
Resolution: Done
-
Major
-
None
-
2
-
False
-
False
-
NEW
-
NEW
-
Undefined
-
-
Logging (Core) - Sprint 198, Logging (Core) - Sprint 199
Story
As an administrator to cluster logging,
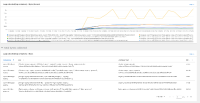
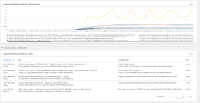
I want a chart that displays the top 10 containers producing the most logs
so that I can understand who are the most chatty.
Acceptance Criteria
- Add a new chart to the existing "Openshift Logging" dashboard that shows the top 10 containers producing logs.
- The chart displays the podname and namespace associated with each metric
- causes
-
LOG-1271 Logs Produced Line Chart does not display podname and namespace labels
-
- Closed
-
- is cloned by
-
LOG-1269 Top 10 logs collected containers chart
-
- Closed
-
-
LOG-1166 Collection log loss chart
-
- Closed
-
- is documented by
-
RHDEVDOCS-2913 Top 10 containers chart and log loss - what to do?
-
- Closed
-
- relates to
-
LOG-1353 No datapoints found on top 10 containers dashboard
-
- Closed
-
- links to
(3 links to)


