-
Bug
-
Resolution: Unresolved
-
 Medium
-
None
-
OSC 1.8.0
-
None
-
None
-
Product / Portfolio Work
-
False
-
-
False
-
-
-
Bugs and Vulnerability Issues
-
0
Description
While attempting to measure the pod overhead, I noticed that for some specific workloads that push memory boundaries, we would end up with pods in "Terminating" condition. This was already reported multiple times:
- https://issues.redhat.com/browse/KATA-2120
- https://issues.redhat.com/browse/KATA-2796
- https://issues.redhat.com/browse/KATA-871
- https://issues.redhat.com/browse/KATA-1853
The protocol I am following is a more advanced version of what was used in https://issues.redhat.com/browse/KATA-335, where I can control how much memory and CPU is being used by the workload.
Changes are this is related to https://github.com/kata-containers/kata-containers/issues/6129.
Steps to reproduce
Run the following script which runs a configurable workloads up to 1000 replicas:
#!/bin/bash
mv -f data.csv data.csv.old
CLUSTER=kata417
WORKERS=6

echo "Iteration,Elapsed,Running,Creating,Total Active Memory,Total Free Memory, Active,0,1,2,3,4,5,Free,0,1,2,3,4,5" > data.csv

for ((I = 0; I < 1000; I++))
do
    START=$SECONDS
    echo "Iteration $I starting at $START, $(date)"
    oc login -u kubeadmin -p $(cat ~/.kcli/clusters/$CLUSTER/auth/kubeadmin-password)
    oc scale --replicas=$I -f workload.yaml
    while ( oc get pods | grep -q ContainerCreating ); do
        echo -n .
    done
    ELAPSED=$(($SECONDS - $START))
    RUNNING=$(oc get pods | grep Running | wc -l)
    CREATING=$(oc get pods | grep ContainerCreating | wc -l)
    echo "  Containers started at $(date) in $ELAPSED seconds"
    echo "  Running $RUNNING containers, Creating $CREATING containers"
    ALL_ACTIVE=""
    ALL_FREE=""
    TOTAL_ACTIVE=0
    TOTAL_FREE=0
    for ((W=0; W<$WORKERS; W++))
    do
        ACTIVE=$(kcli ssh ${CLUSTER}-worker-$W cat /proc/meminfo | grep Active: | awk '{ print $2 }')
        FREE=$(kcli ssh ${CLUSTER}-worker-$W cat /proc/meminfo | grep MemFree: | awk '{ print $2 }')
        ALL_ACTIVE="$ALL_ACTIVE,$ACTIVE"
        ALL_FREE="$ALL_FREE,$FREE"
        TOTAL_ACTIVE=$(($TOTAL_ACTIVE + $ACTIVE))
        TOTAL_FREE=$(($TOTAL_FREE + $FREE))
    done
    echo "$I,$ELAPSED,$RUNNING,$CREATING,$TOTAL_ACTIVE,$TOTAL_FREE,$ALL_ACTIVE,$ALL_FREE" >> data.csv
done
where workload.yaml contains:
apiVersion: apps/v1
kind: Deployment
metadata:
  name: workload-deployment
  labels:
    app: workload

spec:
  replicas: 1
  selector:
    matchLabels:
      app: workload
  template:
    metadata:
      labels:
        app: workload
    spec:
      runtimeClassName: kata
      containers:
      - name: workload
        image: quay.io/c3d/workload
        env:
        - name: CPU
          value: "95"
        - name: MEMORY
          value: "3900"
        - name: INCREMENT
          value: "100"
        resources:
          requests:
            memory: 2048Mi
          limits:
            memory: 4096Mi
Expected result
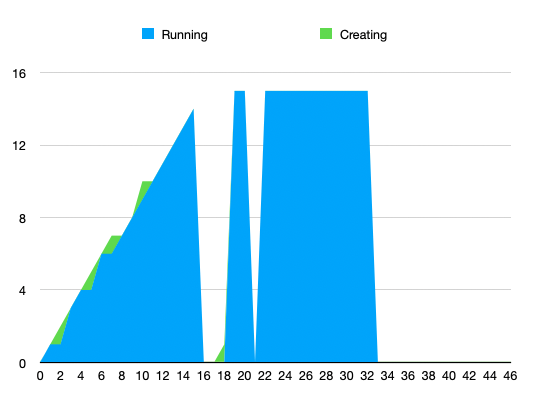
Scaling number of running containers up to some maximum, then steady state.
Actual result
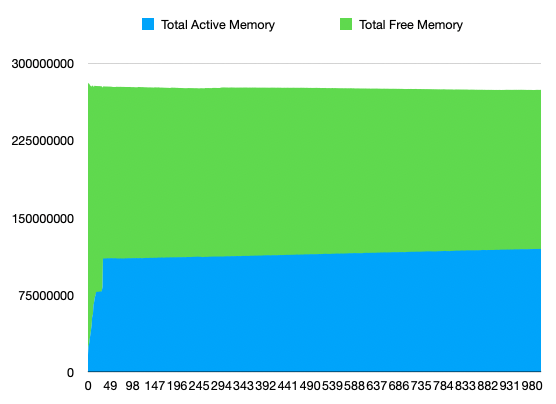
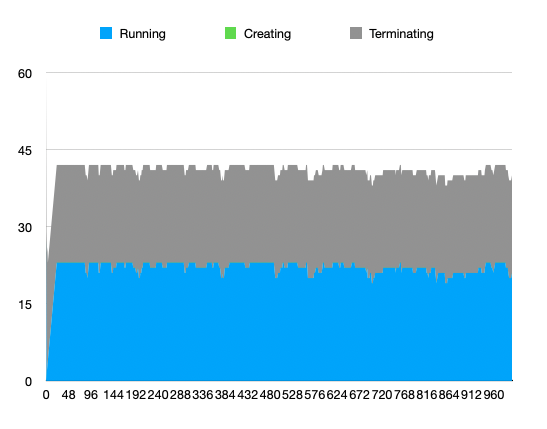
More and more containers end up in the "Terminating" state, until all CPUs are fully pegged at 100% CPU. Memory is measured by the script, and it appears to not be fully utilized.
Impact
This impacts the scalability of OSC, notably relative to runc.
Env
Tested with OCP 4.17 running in a cluster of VMs created using kcli as follows:
kcli create kube openshift --paramfile kcli-ocp417.yaml
with the following configuration:
cluster: kata417
domain: kata417.com
# RHCOS image name in the libvirt storage pool
#image: rhcos-410.84.202201450144-0-qemu.x86_64.qcow2
imagecontentsources: []
mdns: True
# Libvirt network name eg. 192.168.10.0/24
network: openshift-417
# Libvirt storage pool
pool: openshift
api_ip: 192.168.17.254
# Copy the pull secret and store it the following file
pull_secret: openshift_pull.json
# Release version number: 4.7/4.8/4.9
tag: 4.17
# Build type: nightly/stable. The latest nightly or stable build will be automatically downloaded
# If specific version is required then download openshift-install from
# https://mirror.openshift.com/pub/openshift-v4/clients and
# place it in /usr/local/sbin:/usr/local/bin:/usr/sbin:/usr/bin:/root/bin:/root/bin to use the same for install
version: stable
ctlplanes: 3
workers: 6
numcpus: 8
disk_size: 60
memory: 16384
bootstrap_memory: 16384
ctlplane_memory: 28672
worker_memory: 49152
bootstrap_numcpus: 4
ctlplane_numcpus: 4
numcpus: 4
worker_numcpus: 16
ctlplane_macs: []
worker_macs: []
Additional helpful info
Collected memory usage:
Collected number of running / creating containers (will add Terminating in next run):

Working theory
The current working theory is that the problem is caused by the VM dying because it exceeded the host-side cgroup constraints. This would result from k8s receiving incorrect information about how much memory the VM could use. See https://github.com/kata-containers/kata-containers/issues/6129 for upstream description of the issue.
For example, a 2G VM where we hotplug 4G with the current documented overhead of 350M will be seen by k8s as being allowed to use 4G+350M (pod size + overhead), but it may in reality go up to 6G (2G+4G) for example due to in-guest kernel and I/O buffers. In that case, the VM is killed by the host kernel. As KATA-2080 shows, this results in a bad recovery by the runtime.
See KATA-2080 and KATA-2120 for related issues.
- is related to
-
-

- New
-
