-
Bug
-
Resolution: Unresolved
-
 Major
Major
-
None
-
5.4.2
-
False
-
-
False
-
Moderate
We are currently investigating the elevated memory usage of JGroups on our JVM following our upgrades to the latest releases and updates to our configuration to try to resolve the issue. Despite these adjustments, memory consumption by jgroups remains high. Do you suspect that there may be a potential memory leak requiring further analysis, or could our configuration be incorrect? We are utilizing the ZGC Garbage Collector, and I have noted that the ZGC Old Generation frequently fills up with approximately 4GB of objects primarily associated with JGroups. When I trigger a heap dump, it typically leads to a pause substantial enough to clear the ZGC Old Generation.
A heap leak analysis using Eclipse Memory Analyzer will typically list the following. However, once the ZGC cleans up the ZGC Old Generation then it no longer detects jgroups as a suspect.
One instance of org.jgroups.blocks.cs.NioConnection loaded by org.apache.catalina.loader.ParallelWebappClassLoader @ 0x40005ad9980 occupies 1,650,814,824 (40.47%) bytes. The memory is accumulated in one instance of byte[], loaded by <system class loader>, which occupies 1,650,814,080 (40.47%) bytes.
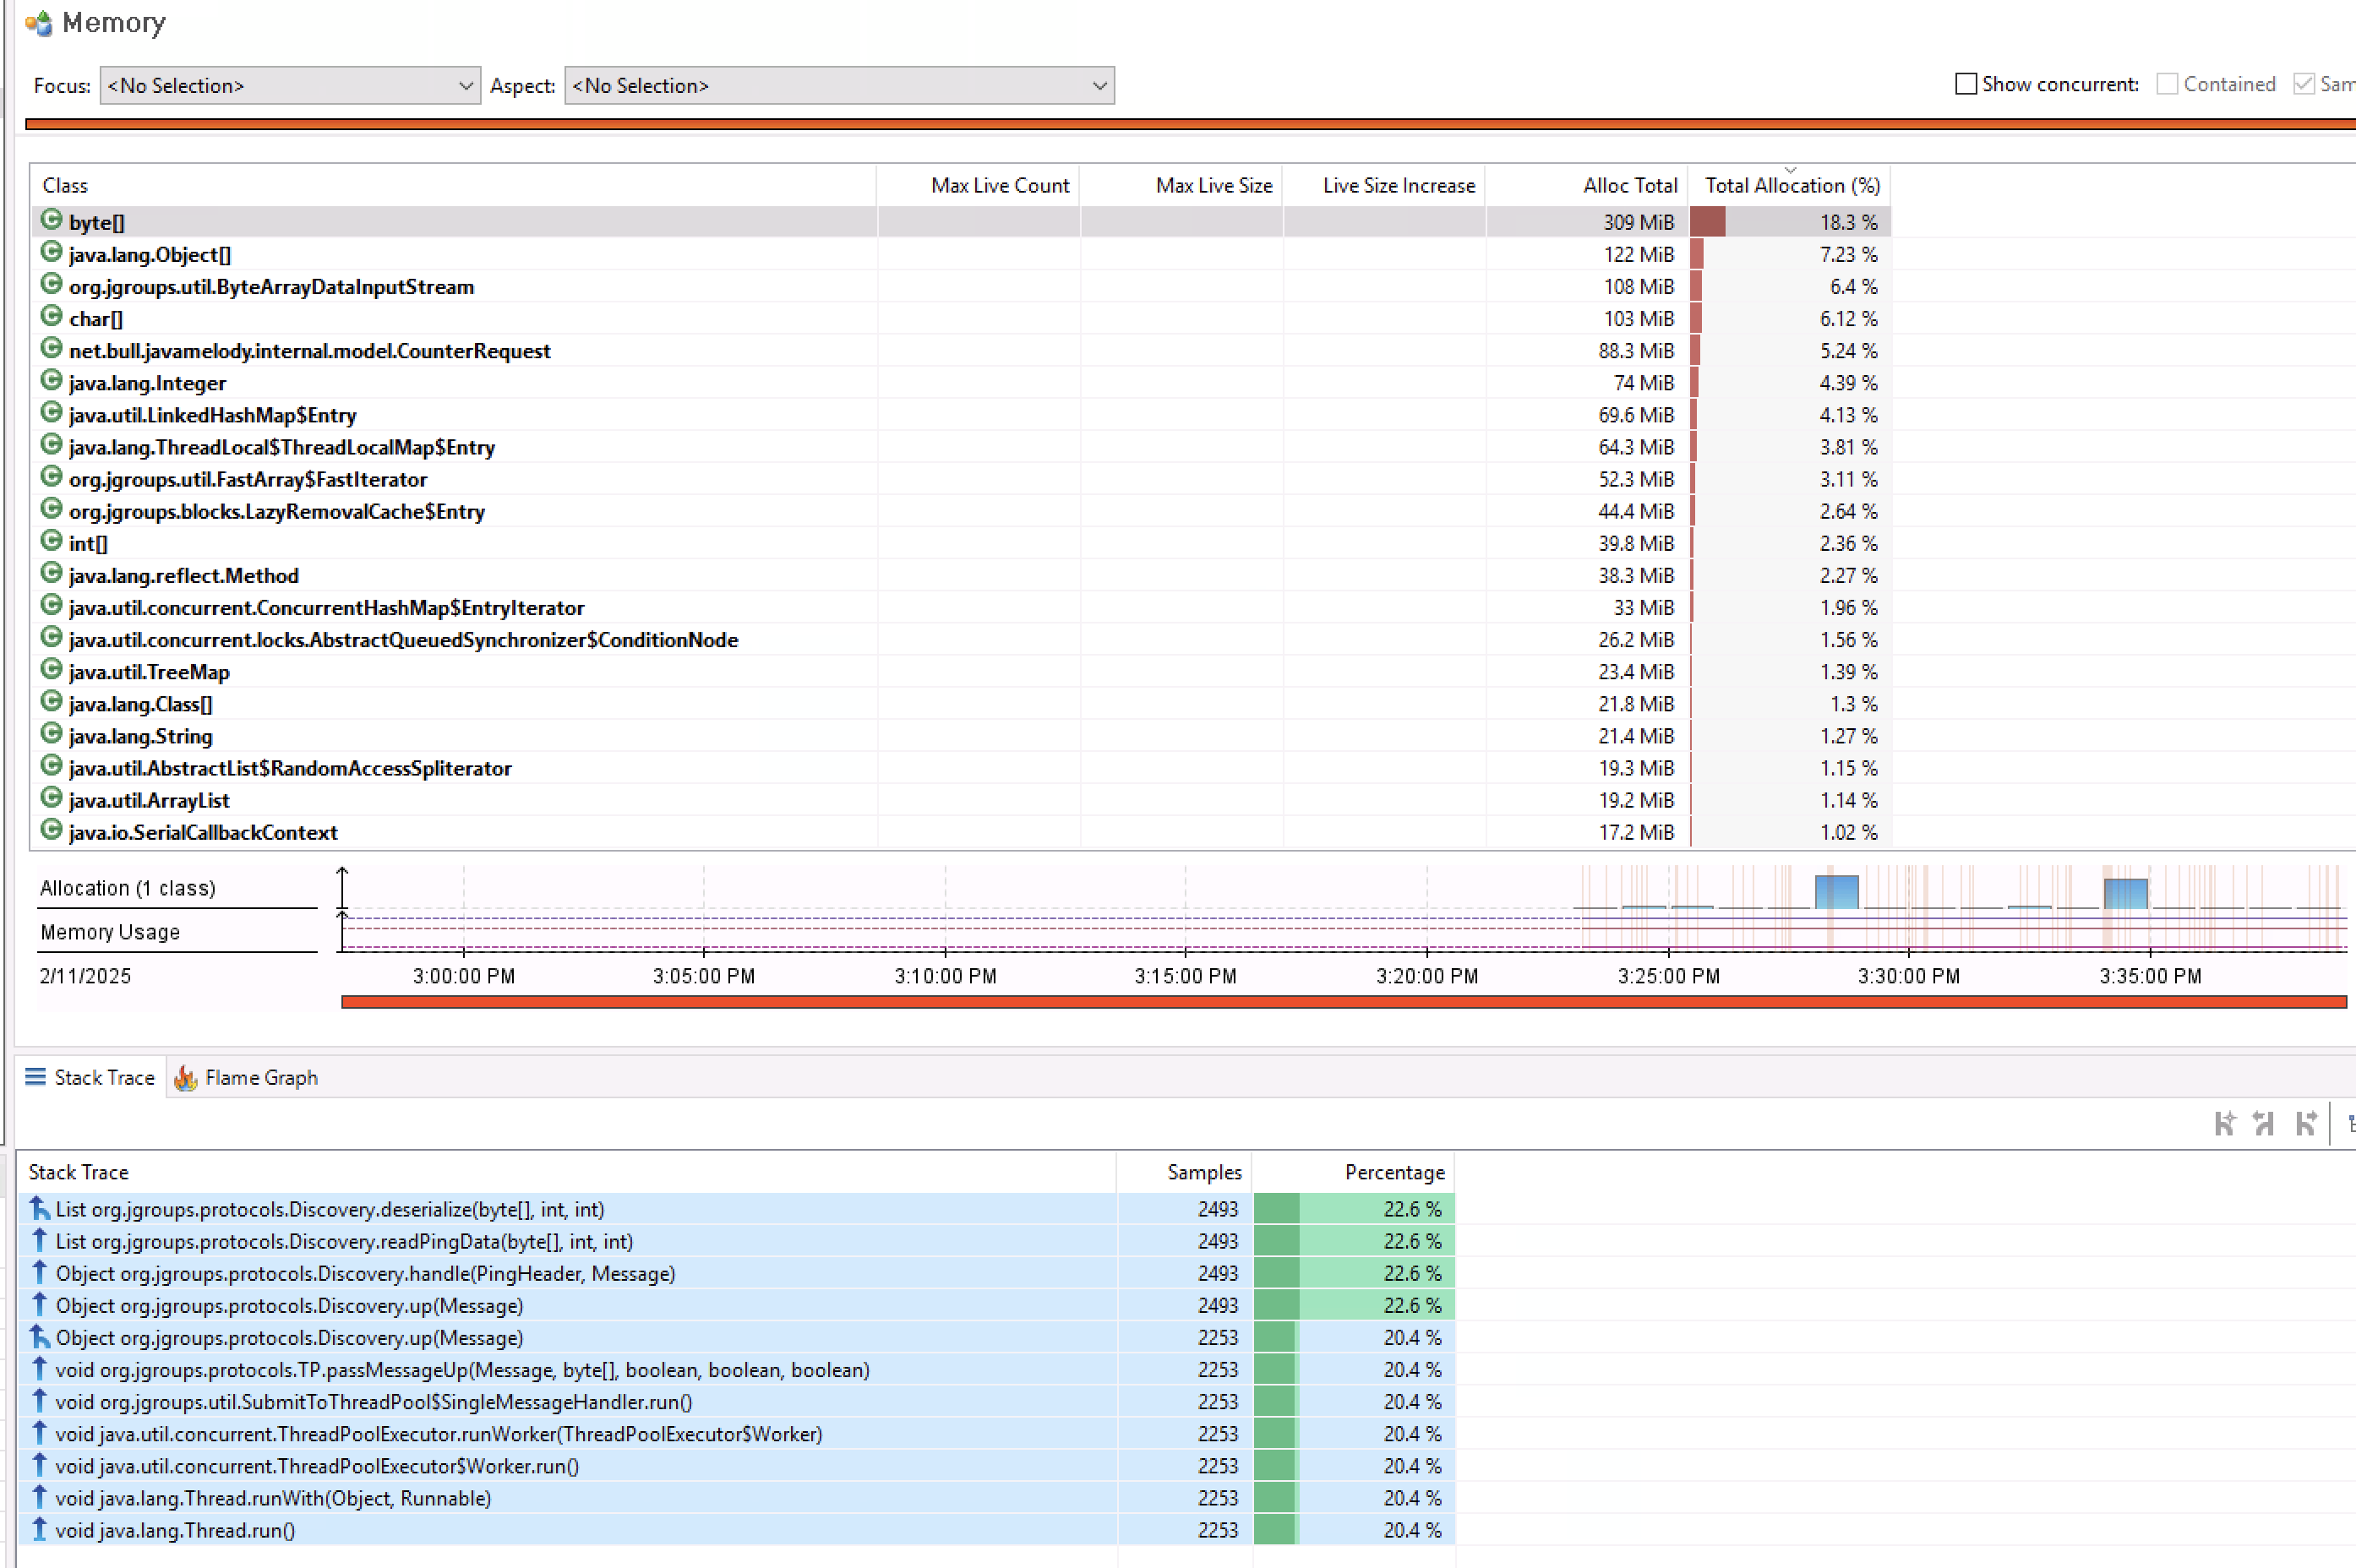
However, using JFR to evaluate the current memory usage after the ZGC Old Generation is cleared out still indicates that JGroups occupy a significant portion of the memory as seen indicated in the attached screen shot, every class in list if you click on it has jgroups classes in the stack traces.
Note, the messages we are sending are relatively small; they merely instruct our applications to clear or refresh their in-memory caches in response to any configuration alterations within our application. Our objective is real-time processing with guaranteed delivery, which explains our current configuration.
Here is our config.
<config xmlns="urn:org:jgroups"
xmlns:xsi="http://www.w3.org/2001/XMLSchema-instance"
xsi:schemaLocation="urn:org:jgroups http://www.jgroups.org/schema/jgroups.xsd">
<TCP_NIO2
bind_addr="${jgroups.bind_addr:match-address:192.168.57.*,GLOBAL}"
bind_port="${jgroups.bind_port:7800}"
port_range="15"
thread_pool.min_threads="0"
thread_pool.max_threads="200"
thread_pool.keep_alive_time="30000"
diag.enable_tcp="true"
diag.enable_udp="false"
tcp_nodelay="true"
diag.port="7500"
diag.port_range="15"
diag.bind_addr="${jgroups.bind_addr:match-address:192.168.57.*,GLOBAL}"
use_acks="true"
bundler_type="no-bundler"
/>
<TCPPING async_discovery="true"
initial_hosts="${jgroups.tcpping.initial_hosts:as01[7800],as02[7800],as03[7800],as04[7800]}"
return_entire_cache="${jgroups.tcpping.return_entire_cache:false}"
port_range="${jgroups.tcp.port_range:15}"
use_disk_cache="false"
send_cache_on_join="true"
stagger_timeout="1000"
num_discovery_runs="1000"
break_on_coord_rsp="false"
/>
<PING/>
<MERGE3 min_interval="1000" max_interval="10000" check_interval="15000"/>
<FD_SOCK2/>
<FD_ALL3 timeout="8000" interval="3000"/>
<VERIFY_SUSPECT2 timeout="1500" />
<NAKACK4 use_mcast_xmit="false" capacity="8192"/>
<UNICAST4 />
<pbcast.GMS print_local_addr="true"
join_timeout="2000"
max_join_attempts="0"
print_view_details="true"
print_physical_addrs="true"
/>
<FRAG4 frag_size="60K" />
<pbcast.STATE_TRANSFER/>
</config>