-
Bug
-
Resolution: Done
-
Critical
-
None
-
None
Hi Clebert,
I hit OutOfMemory exception during server startup. It seems that HornetQ loads records from journal file into memory and there are no limits for it. This situation should not happen. Customer will have serious issue if he hits this issue and will not be able to manage data.
I am putting this issue to critical priority because I do not have reproducer for it now and journal file comes from automated test which was executed with invalid configuration. But server should be able to deal with this situation and it should not end with OOM.
I have hit this issue with journal file from automated test when I had bad configuration of JCA adapter and I had two servers in cluster. I will try to prepare reproducer but I was able to extract following information from journal:
- Bindings records look good
- Messages records look good (start of journal, expected number of records)
And there are huge amount of following records:
...
operation@Update,recordID=27;userRecordType=34;isUpdate=true;DeliveryCountUpdateEncoding [queueID=5, count=1]
operation@Update,recordID=29;userRecordType=34;isUpdate=true;DeliveryCountUpdateEncoding [queueID=5, count=0]
operation@Update,recordID=31;userRecordType=34;isUpdate=true;DeliveryCountUpdateEncoding [queueID=5, count=0]
...
It seems that this type of record (DeliveryCountUpdateEncoding) is not removed from list of journal records like is done for transaction records which is hold in load method.
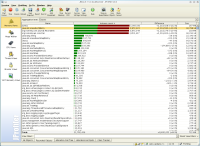
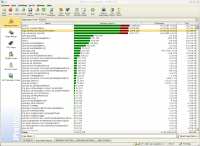
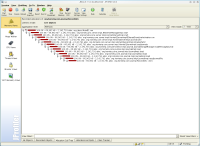
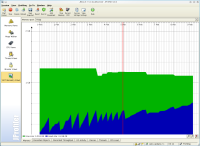
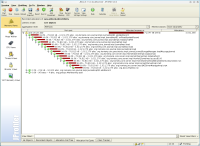
Screen shots from Jprofiler will be attached in several minutes. This data will give you information where can be problem located. It seems that loading of the journal records into memory is not limited. Problem probably lays in org.hornetq.core.journal.impl.JournalImpl.load. See hornetq-memory9.png.
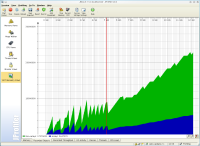
Red mark in the pictures represents HornetQ server start time. Memory graph was created before OOM but you can see progress of occupied memory.
