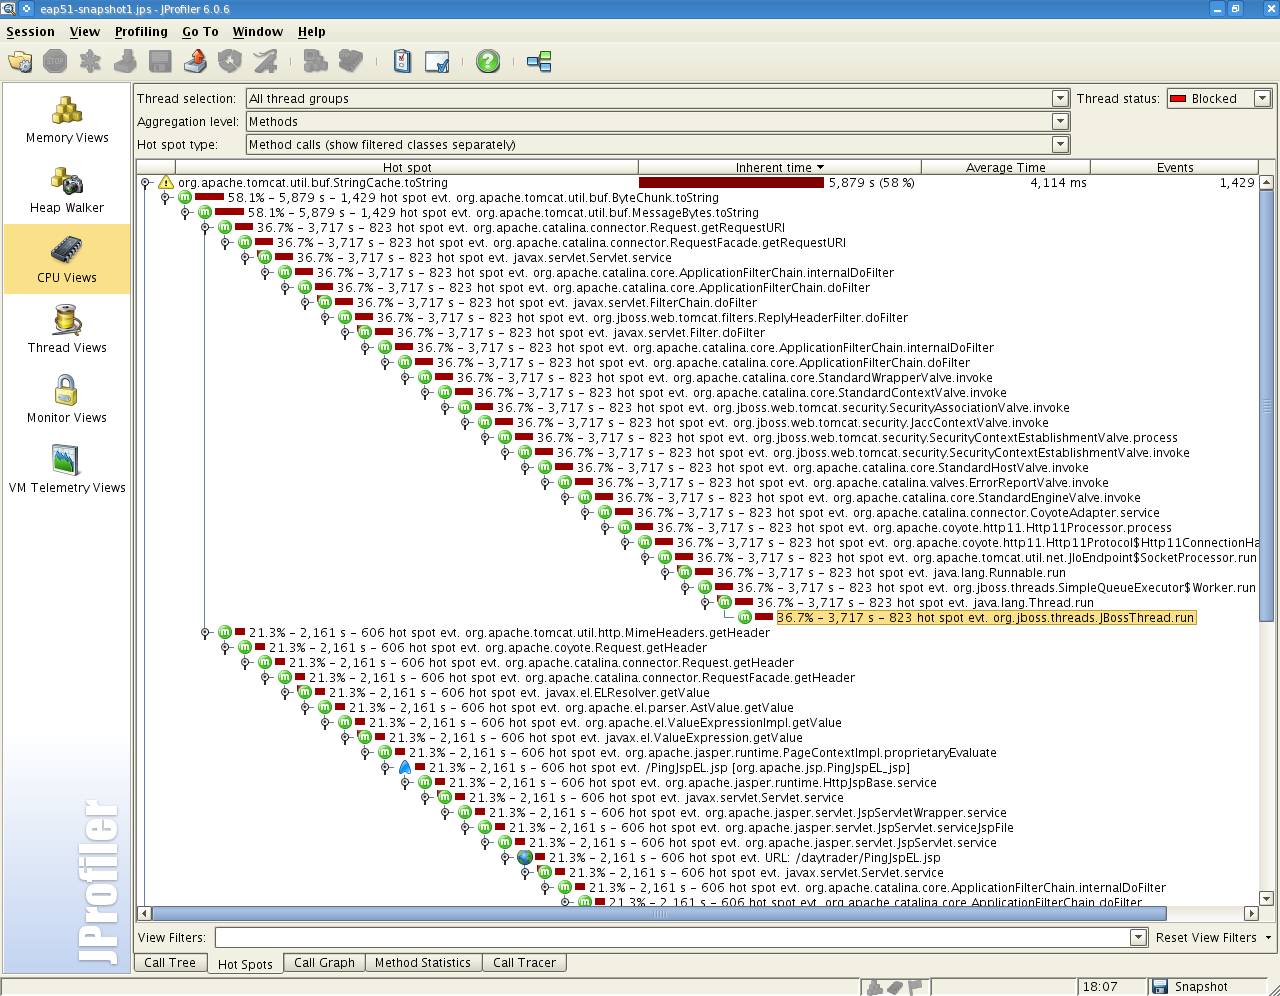
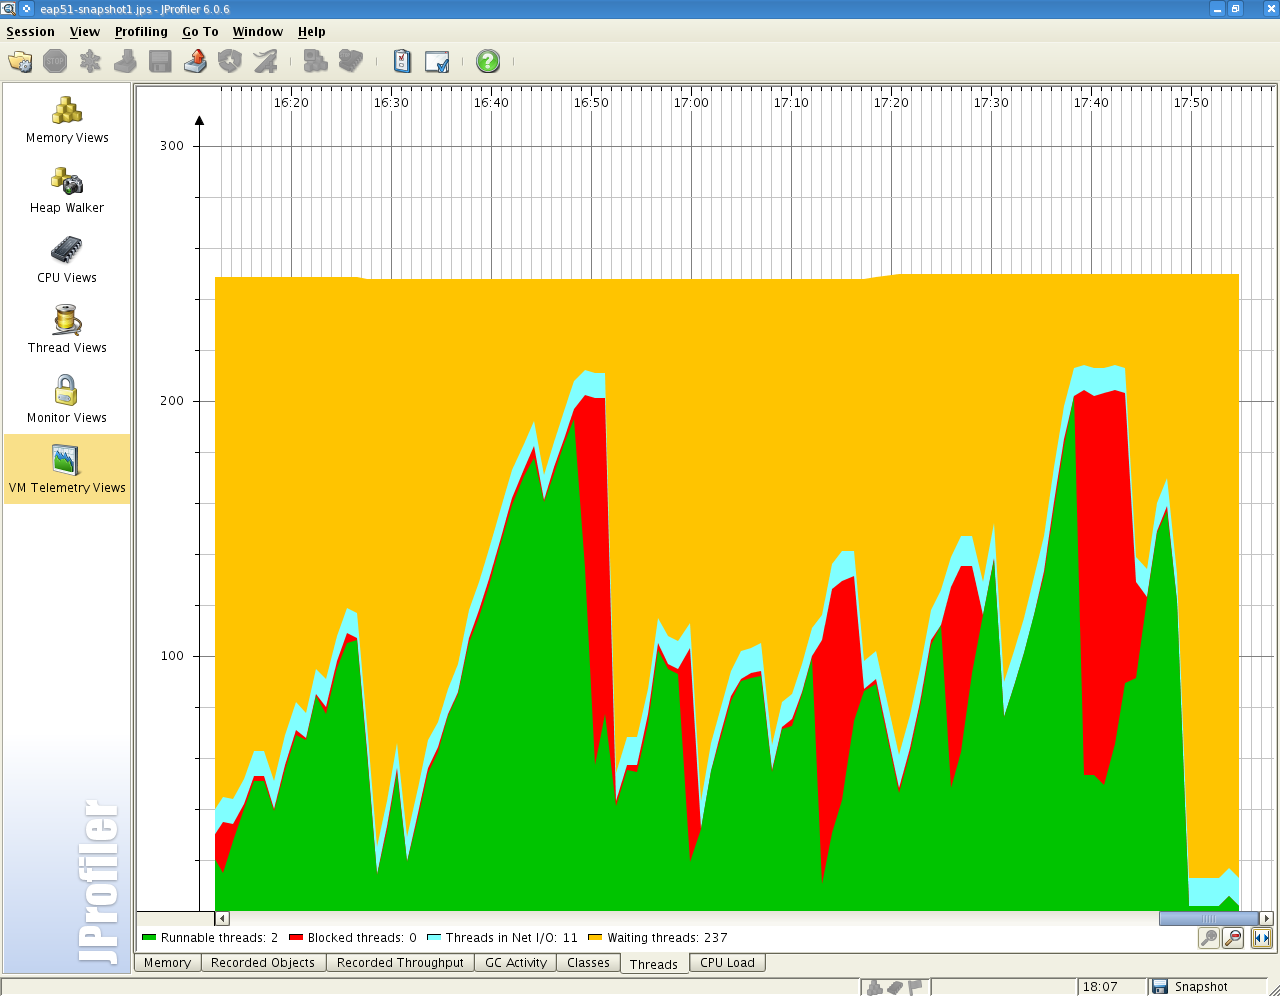
JProfiler shows that under certain scenario 58% of the threads spend in state blocked is in the org.apache.tomcat.util.buf.StringCache.toString (58.1% - 5,879 s - 1,429 hot spot evt.).
From my understanding this cache is turned on by default and is caching ByteChunks toString results (toStringInternal). This method contains a huge synchronization block which prepares the cache. In the test, its blocked by (of total)
- 36% Request.getRequestURI (and further)
- 21% MimeHeader.getHeader (and further, EL on the way)
The performance risk is that at the beggining of starting JBAS (until a first chunk gets 20000 requests of toString for the cache to stop preparing (training)) the server suffers from thread contention. Note that the server needs to be under high concurrent load and relatively simple workload.
All ours tests are quite short, so what this means for QE, is that we might consider turning this cache off for short tests, or rather set the training threshold very low (which then makes the use of the cache).
What performance gain it shows for this particular scenario is hard to determine, results are varying a bit, it might be somewhere about 1%.
Screenshots attached for better understanding.
