-
Epic
-
Resolution: Done
-
 Critical
-
None
-
None
-
False
-
-
False
-
-
-
-
-
-
-
./standalone.sh
watch -n 1 "./jboss-cli.sh -c :reload"

# show leak
wget   https://github.com/check-leak/check-leak/releases/download/0.11/check-leak-0.11.jar
java -jar check-leak-0.11.jar remote --pid <PID_OF_EAP> --report /tmp/report --sleep 5000
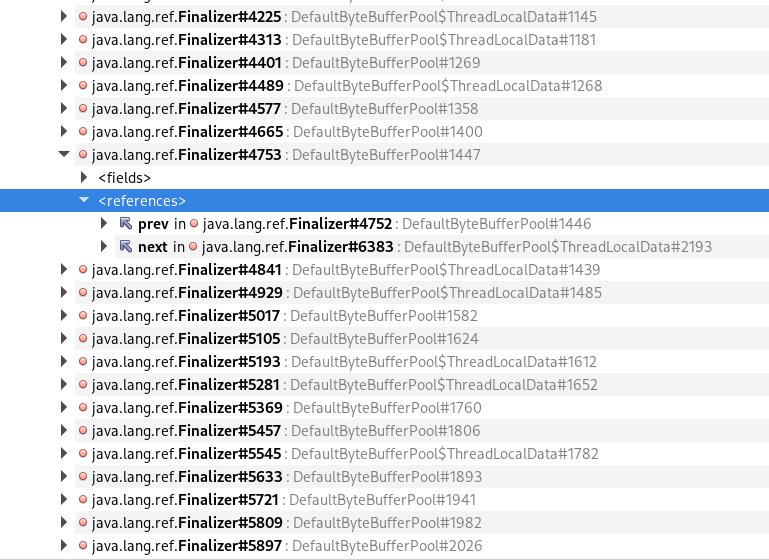
Tool https://github.com/check-leak/check-leak works on principle of reporting new maximum of instances per class. After some time report stabilize to this output
*******************************************************************************************************************************
Executing...
Processing histogram
|         1881104 bytes (+6864)|         12059 instances (+44)|[Ljava.lang.Thread; (java.base@17.0.8)
|         1302240 bytes (+4752)|         27130 instances (+99)|java.lang.ThreadGroup (java.base@17.0.8)
|          386752 bytes (+1344)|          6043 instances (+21)|io.undertow.server.DefaultByteBufferPool
|           227568 bytes (+352)|          3016 instances (+11)|[Ljava.lang.ThreadGroup; (java.base@17.0.8)
|           146064 bytes (+480)|          3043 instances (+10)|java.util.concurrent.ConcurrentSkipListMap (java.base@17.0.8)
|           145896 bytes (+456)|          6079 instances (+19)|java.util.concurrent.ConcurrentLinkedQueue (java.base@17.0.8)
|           144672 bytes (+528)|          3014 instances (+11)|org.wildfly.transaction.client.provider.jboss.JBossJTALocalTransactionProvider
|           142104 bytes (+504)|          5921 instances (+21)|io.undertow.server.DefaultByteBufferPool$ThreadLocalData
|           120880 bytes (+440)|          3022 instances (+11)|java.io.FilePermission (java.base@17.0.8)
|            97744 bytes (+288)|          6109 instances (+18)|java.lang.ThreadLocal (java.base@17.0.8)
|            96448 bytes (+352)|          3014 instances (+11)|org.wildfly.transaction.client.provider.jboss.FileSystemXAResourceRegistry
|            48656 bytes (+160)|          3041 instances (+10)|java.util.concurrent.ConcurrentSkipListSet (java.base@17.0.8)
|            48224 bytes (+176)|          3014 instances (+11)|com.arjuna.ats.internal.jbossatx.jta.XAResourceRecoveryHelperWrapper
|            48224 bytes (+176)|          3014 instances (+11)|com.arjuna.ats.internal.jbossatx.jta.jca.XATerminator
|            48224 bytes (+176)|          3014 instances (+11)|org.wildfly.transaction.client.provider.jboss.JBossLocalTransactionProvider$$Lambda$813/0x00007f373a73e3a8
|            48224 bytes (+176)|          3014 instances (+11)|org.wildfly.transaction.client.provider.jboss.JBossLocalTransactionProvider$XAImporterImpl
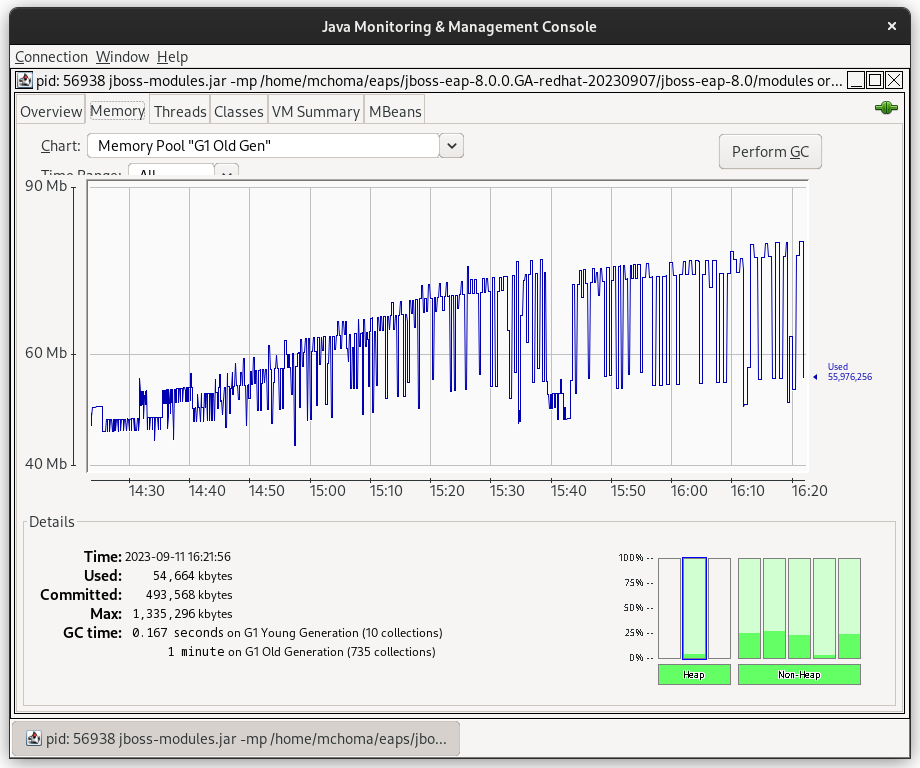
This mean those classes reach new occurence maximum each time server is reloaded. Even running GC can't stop that observation. Maximum is continuosly rising. When I stop reloading server new maxima are not reported anymore. Increasing trend can be seen also in jconsole diagrams.

I can observe same behaviour in EAP74, so this is not regression compared to EAP 74. In EAP 74 the trend is much steeper, so maybe there is also different leak.
- is blocked by
-
JBEAP-25714 (8.0.z) WELD-2755 Avoid creating duplicate thread groups
-

- Closed
-
-
-
- Closed
-
-
-
- Closed
-
-
-
- Closed
-
-
-

- Closed
-
- is cloned by
-
-
- Closed
-