-
Epic
-
Resolution: Done
-
 Critical
-
7.4.12.GA
-
False
-
-
False
-
-
-
-
-
-
-
./standalone.sh
cp jsf_reproducer.war deployments
# this redeploys application in infinite loop
watch -n 1 touch jsf_reproducer.war.dodeploy

# show leak
wget   https://github.com/check-leak/check-leak/releases/download/0.11/check-leak-0.11.jar
java -jar check-leak-0.11.jar remote --pid <PID_OF_EAP> --report /tmp/report --sleep 5000
Tool https://github.com/check-leak/check-leak works on principle of reporting new maximum of instances per class. After some time report stabilize to this output
*******************************************************************************************************************************
Executing...
Processing histogram
|          3005296 bytes (+208)|          57779 instances (+4)|[Ljava.lang.Thread; (java.base@17.0.7)
|          2773680 bytes (+192)|          57785 instances (+4)|java.lang.ThreadGroup (java.base@17.0.7)
|            693264 bytes (+48)|          14443 instances (+1)|org.infinispan.factories.threads.BlockingThreadFactory$ISPNBlockingThreadGroup
|            693264 bytes (+48)|          14443 instances (+1)|org.infinispan.factories.threads.NonBlockingThreadFactory$ISPNNonBlockingThreadGroup
|            346680 bytes (+24)|          14445 instances (+1)|org.wildfly.extension.metrics.MetricCollector$1
|            346680 bytes (+24)|          14445 instances (+1)|org.wildfly.extension.metrics.MetricRegistration
*******************************************************************************************************************************
This mean those classes reach new occurence maximum each time application is redeployed. Even running GC cant stop that observation. Maximum is continuosly rising.
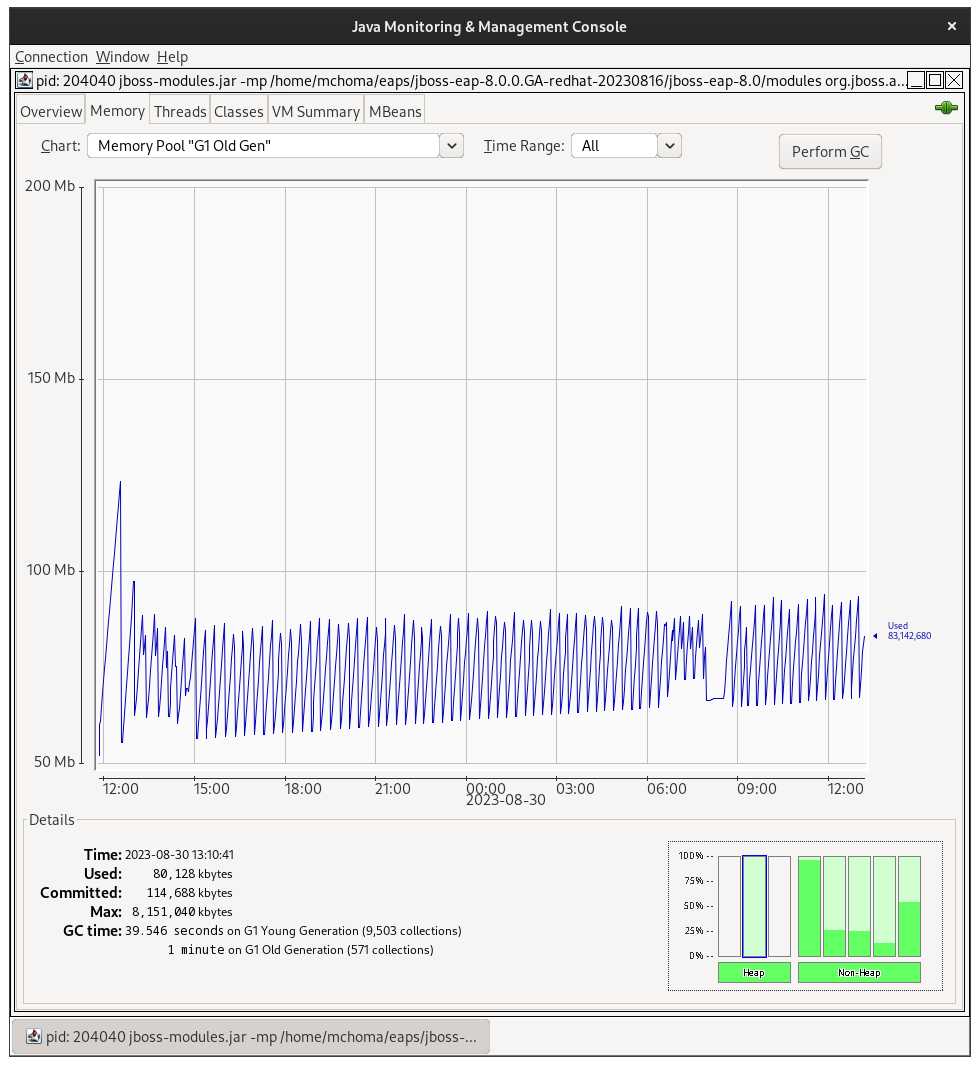
Overal number of instances match number of redeploys. When I stop redeploying app new maxima are not reported. Increasing trend can be seen also in this diagram of Old Gen Memory Heap area.

- clones
-
JBEAP-25513 (8.0.z) Memory leak on app redeploy
-
- Closed
-
- is blocked by
-
-

- Closed
-
-
-
- Closed
-
- is related to
-
-
- Closed
-