-
Bug
-
Resolution: Obsolete
-
 Major
Major
-
None
-
8.0.0.GA-CR1
-
False
-
-
False
-
-
-
-
-
-
Known Issue
-
-
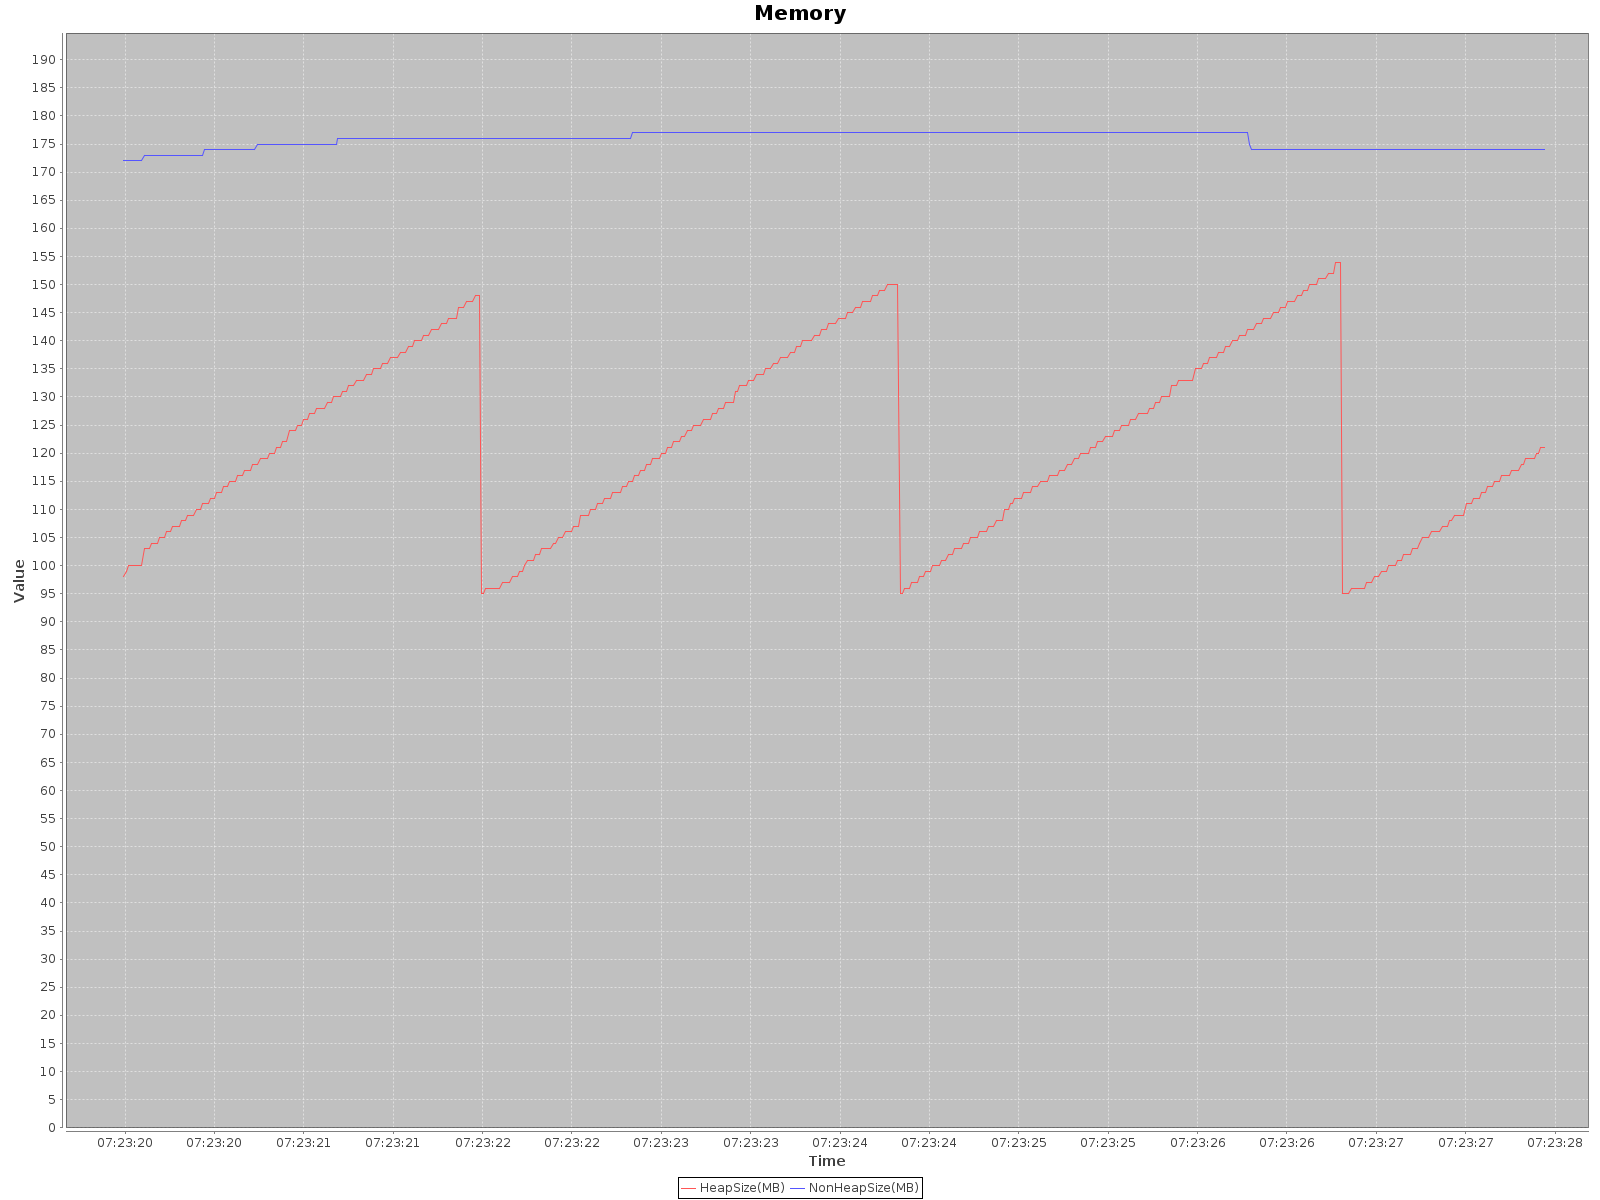
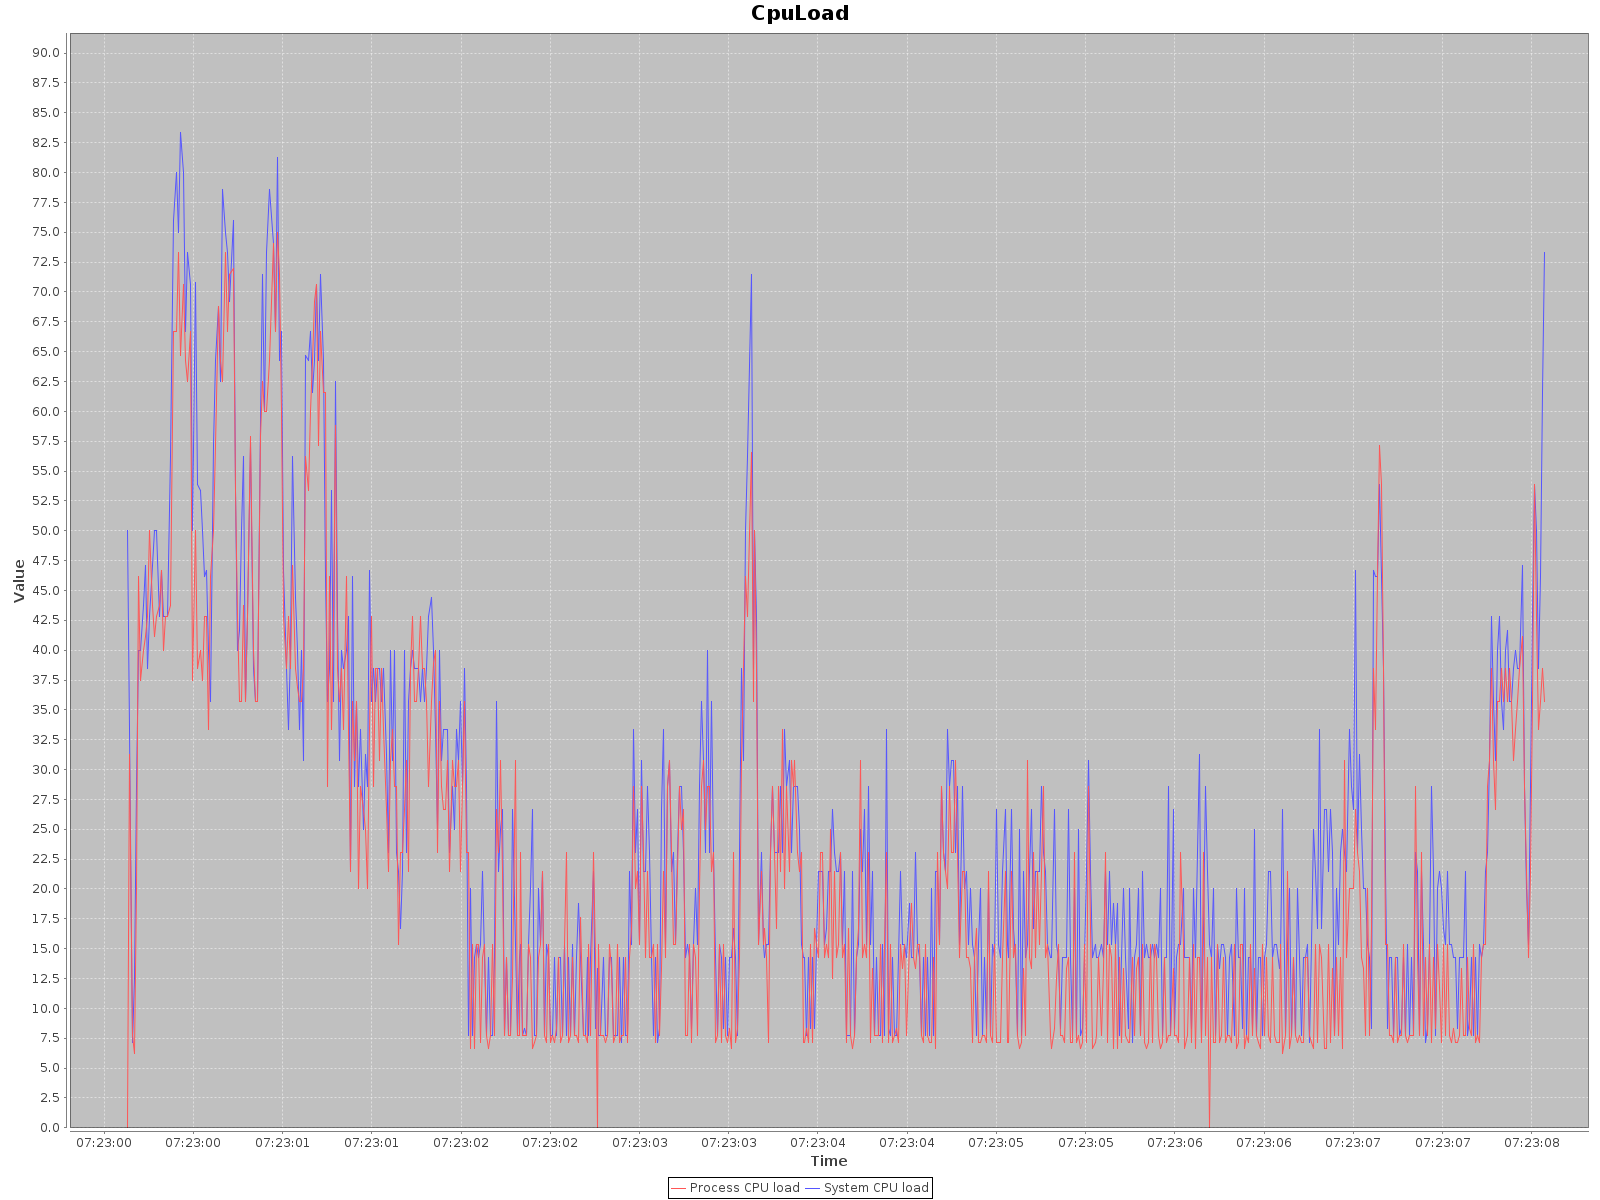
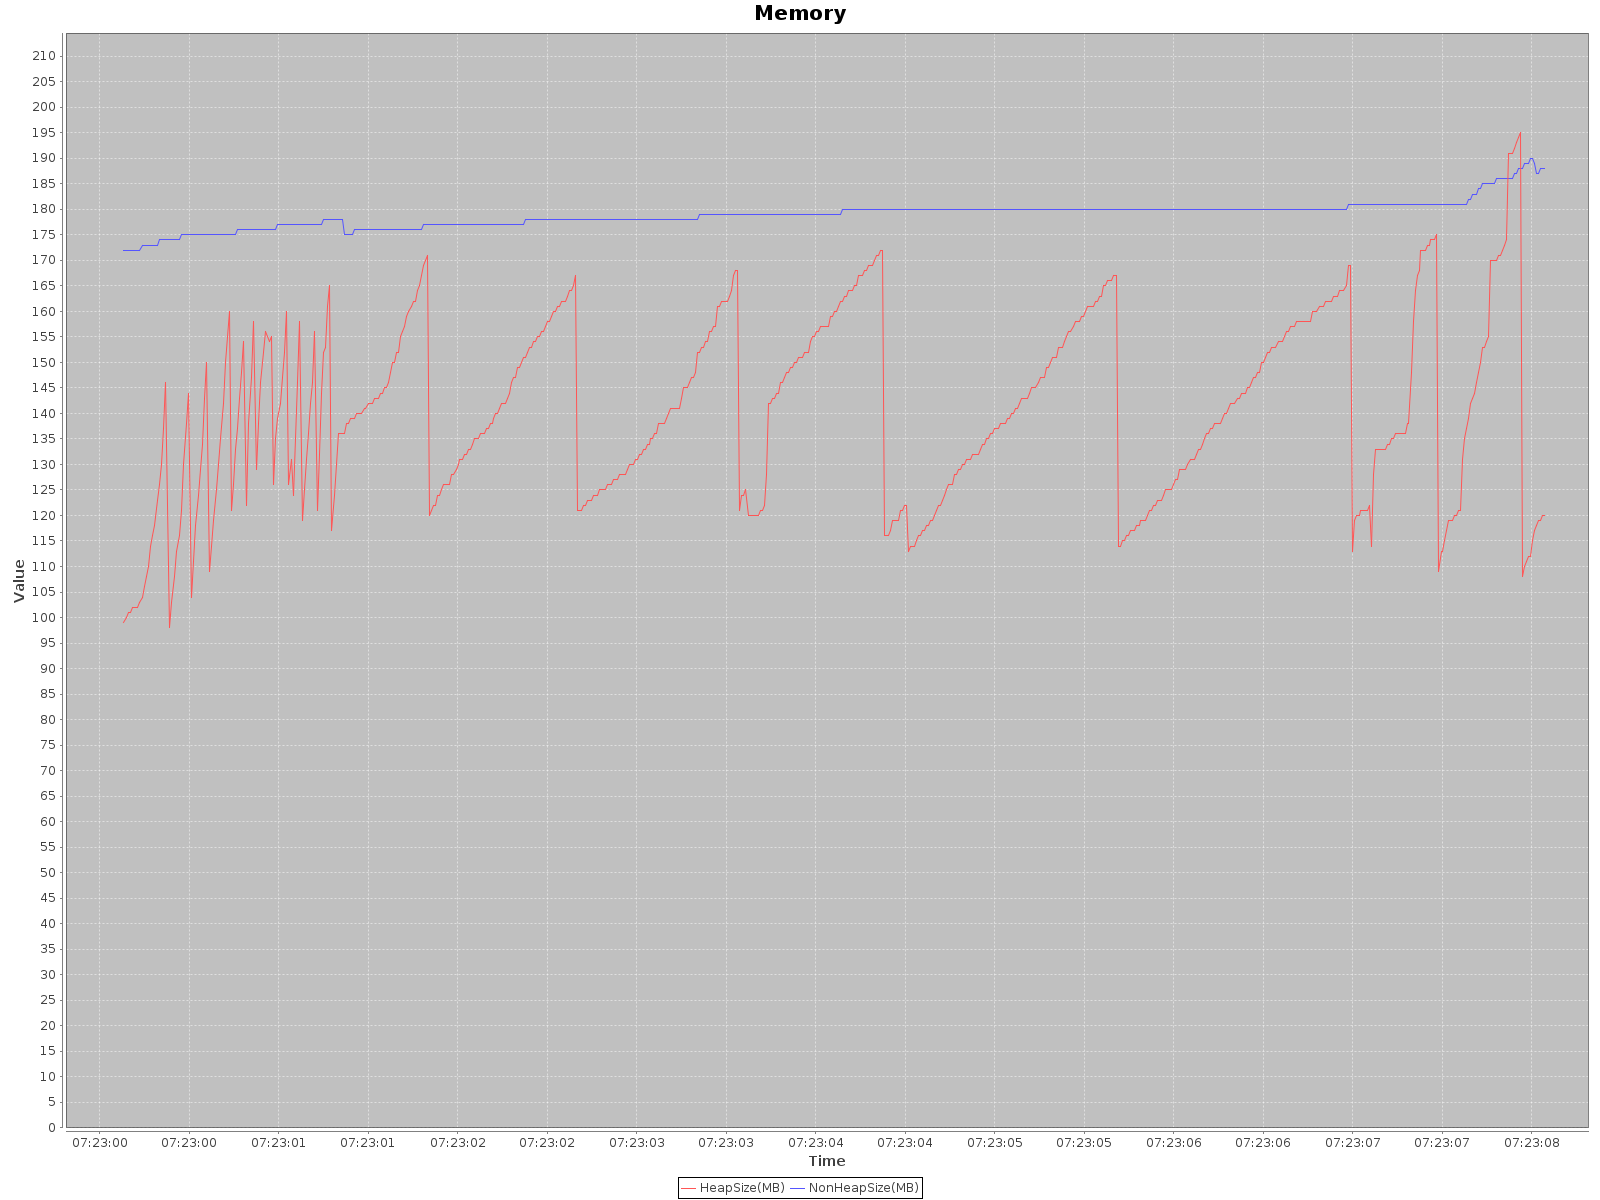
EAP 8 with Insights enabled consumes CPU when generating report. See attached CPU usage graphs (red line) and memory graph where is compared CPU/Memory utilization with and without Insights.
Reading the graphs is tricky thus adding important details to measuments:
- in CPU graph look at the red line which is EAP process (blue is overall operating system)
- Generated on my laptop (8 CPU cores) so there might differences on servers with special hardware (for example for scanning and computing sha1s)
- Generation of report consists of 3 phases: read model (this was where original OOME happened) -> scanning modules -> scanning deployments. In graphs there can be roughly seen move from one phase to the other.
- There is used standalone-full-ha.xml with problematic configuration pieces from customer cases in EAPSUP-1196 (admin-objects, datasources). There are no deployments so the focus is on reading configuration and default modules.
- Those graphs are just from the 1st run of report generation where all modules/deployments are scanned.
- Scanning modules/deployments happens just in the 1st run. Next runs will look only at changes deployments/modules. Reading configuration happens for every report generation (each 24 hours). It's intensive but short operation ( <2 sec) in comparison to other phases.
Customer impact: Genaration of the report creates CPU spikes. First generation of report will be generally more intrusive then subsequent ones (see details above) which is by default every 24 hours. This can affect HTTP latences for running service or unavailibility of service in case that server is under heavy load. Time of report generation heavily depends on number of modules/deployments and their sizes. In extreme case with 1500+ jars (1-50MB) in modules it takes ~5 minutes.
There is jira JBEAP-25061 for perf team to evaluate impact of enabled Insights reporting on EAP performance in SpecJ benchmark.