-
Enhancement
-
Resolution: Done
-
 Major
Major
-
None
-
None
-
None
Several small memory hotspots have been discovered during some performance testing of local caches. Optimise them.
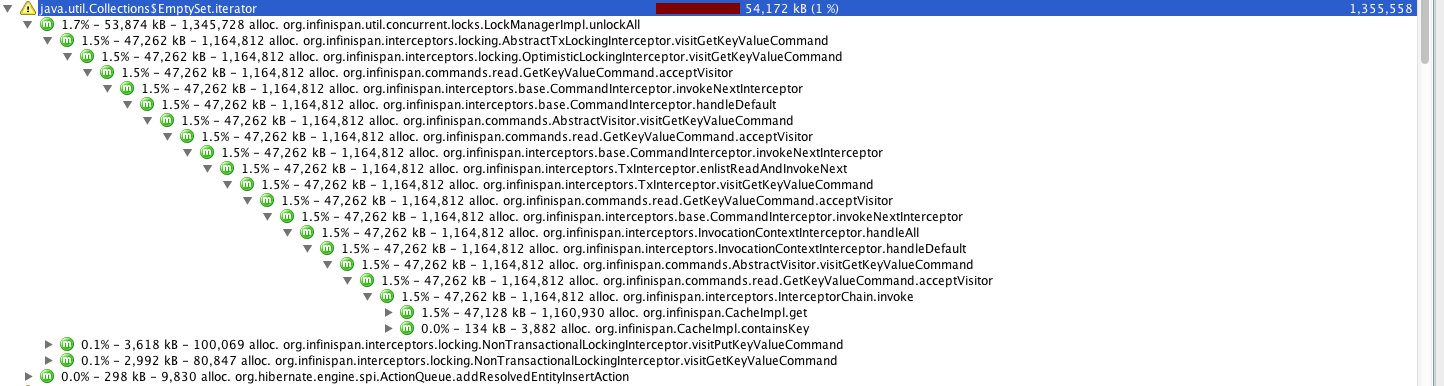
1. Collections.EmptySet.Iterator: Screen%20Shot%202012-10-17%20at%201.21.48%20PM.png
- First of all, iterating over an empty set returns a brand new iterator instance all the time. WTF?
- Second, why does get() have to call unlockAll()? We do not acquire locks on get (unless it has a FORCE_WRITE_LOCK flag on it), right?
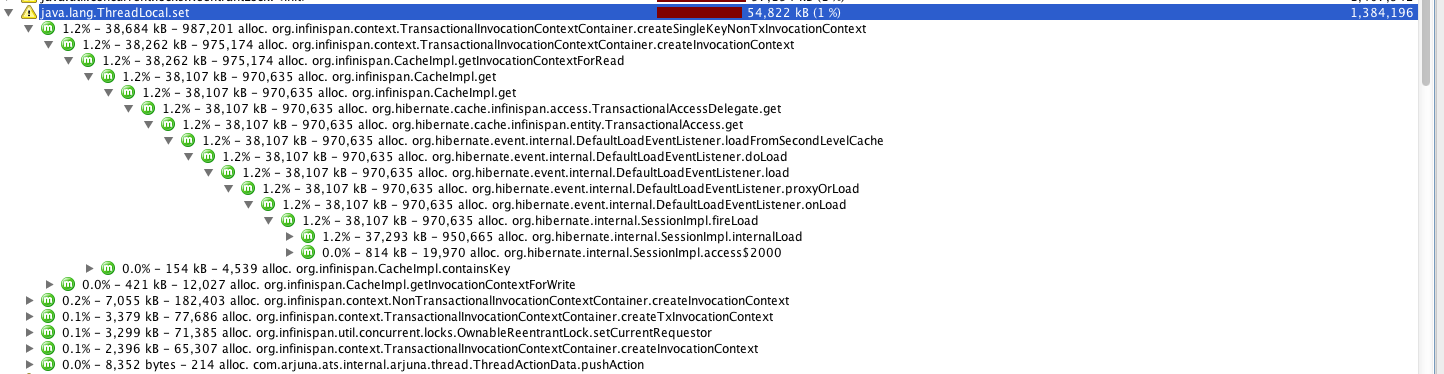
2. ThreadLocal.set: Screen%20Shot%202012-10-17%20at%201.25.45%20PM.png
- Is this neeeded at all?
- If it's needed for any use case, can it be optimised away to avoid using it for a local cache where no marshaller is used, and where no cluster cache loader is used?
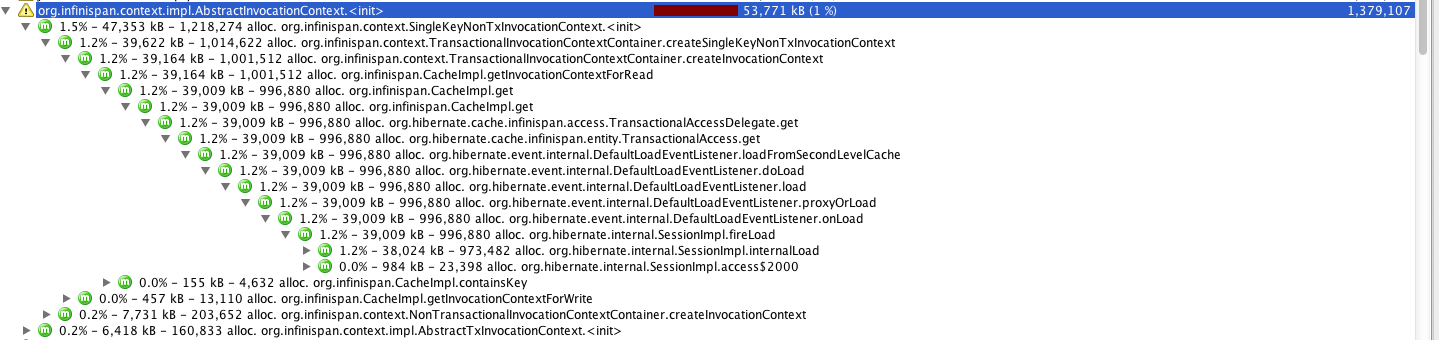
3. AbstractInvocationContext instances: Screen%20Shot%202012-10-17%20at%201.30.09%20PM.png
- Why is this expensive? Is it cos the reference to the ClassLoader?
- If it's the ClassLoader ref, can we move this away for local caches?
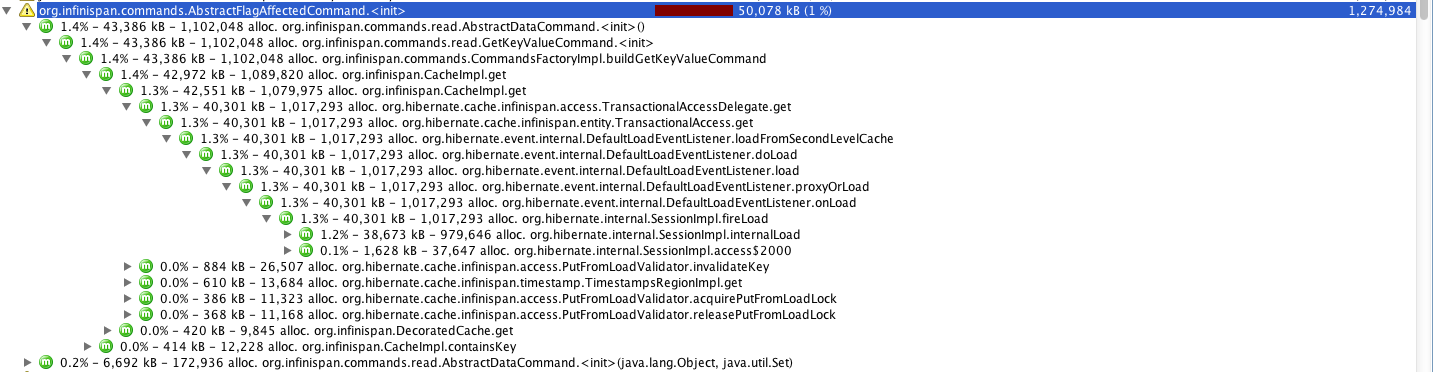
4. AbstractFlagAffectedCommand instances: Screen%20Shot%202012-10-17%20at%201.33.46%20PM.png
- Might be worth thinking how can we shrink these commands for local, unflagged, operations, such as get?