-
Story
-
Resolution: Done
-
Undefined
-
None
-
None
-
None
-
8
-
False
-
False
-
RHDP-286 - Drive metrics needs to allow us to properly target our workload and developer-focused adoption efforts
-
undefined
-
-
AppSvc Sprint 208, AppSvc Sprint 209
Owner: Architect:
Story (Required)
As an OpenShift helm cluster operator, I will like have the count of each charts install, so I can determine which helm chart are used and to what is the level of adoption.
Background
We need to start creating metrics for helm at the local cluster level, so that we can later promote them to be aggregated at the Thanos level.
Glossary
Prometheus: https://prometheus.io/docs/prometheus/latest/getting_started/
Out of scope
Sending metrics to be aggregate in Thanos in this story
Being able to track status of a chart after the install
In Scope
Local Prometheus metrics
Approach(Required)
We need to create a metrics endpoint and register with Prometheus. The firs metric we will focus on this story will be console_helm_chart_installs. The value will be counter that increases as a specific chart gets installed. There are two dimension/properties attached to the metric:
- The name of the chart
- The version of the chart
We will need to study how Prometheus work in general and how it is being used to send metrics in redhat. We can study the way samples operator does this here: https://github.com/openshift/cluster-samples-operator/blob/master/pkg/metrics/server.go
Dependencies
Prometheus is deployed and configured in OpenShift cluster
Edge Case
NA
Acceptance Criteria
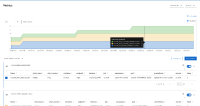
![]() We can see the metric console_helm_chart_installs with all it's dimensions for each release deployed
We can see the metric console_helm_chart_installs with all it's dimensions for each release deployed
![]() There is a wiki section explaining how to add local metrics to Prometheus
There is a wiki section explaining how to add local metrics to Prometheus
INVEST Checklist
![]() Dependencies identified
Dependencies identified
![]() Blockers noted and expected delivery timelines set
Blockers noted and expected delivery timelines set
![]() Design is implementable
Design is implementable
![]() Acceptance criteria agreed upon
Acceptance criteria agreed upon
![]() Story estimated
Story estimated
Legend
![]() Unknown
Unknown
![]() Verified
Verified
![]() Unsatisfied
Unsatisfied
