Uploaded image for project: 'Hawkular'
  1. Hawkular
  2. HAWKULAR-375

Chart Alert Area Errors

XMLWordPrintable

    • Icon: Bug Bug
    • Resolution: Done
    • Icon: Major Major
    • 1.0.0.Alpha2
    • 1.0.0.Alpha1
    • User Interface
    • None

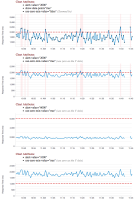
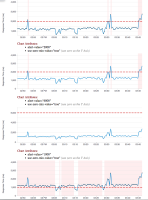
      Although the charts render the various scenarios properly, now that we have live data there are some issues with that data.

      1) start or ending values that end above the alert threshold do not get closed with an alert area.

      2) Some spurious areas above threshold that dont get shaded in properly. Will have to look into this more (probably due to interpolation vs actual values).
        1. sample-dataset.png
          sample-dataset.png
          152 kB
        2. charts-test.png
          charts-test.png
          173 kB
        3. chart-errors.png
          chart-errors.png
          36 kB

              mithomps1@redhat.com Mike Thompson (Inactive)
              mithomps1@redhat.com Mike Thompson (Inactive)
              Votes:
              0 Vote for this issue
              Watchers:
              1 Start watching this issue

                Created:
                Updated:
                Resolved: