-
Sub-task
-
Resolution: Done
-
Critical
-
None
-
None
-
None
I have a url that was up for >>1h, the chart showed 1/2green and 1/2 grey
To provoke a change, I added the target host quickly to /etc/hosts and removed it shortly after again. This provoked a downtime of 33s.
Yet the charts show 1h of downtime and only very limited uptime.
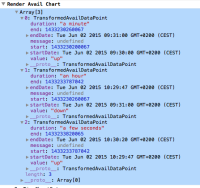
Looking at the web console I get the impression that the computation of the data points is wrong. See screen shots.
[Log] Availability Data:  (hawkular-console.js, line 3013)
[Log] Array[3] (hawkular-console.js, line 3014)
0: Resource
timestamp: 1433230740123    <<-- 9:39
value: "up"
__proto__: Resource
1: Resource
timestamp: 1433233787042    <<-- 10:29:47 - going down
value: "down"
__proto__: Resource
2: Resource
timestamp: 1433233820065    <<-- 10:30:20 -- up again
value: "up"
__proto__: Resource
$promise: Object
$resolved: true
length: 3
__proto__: Array[0]
$ date -j -f %s 1433230740
Di 2 Jun 2015 09:39:00 CEST
$ date -j -f %s 1433233787
Di 2 Jun 2015 10:29:47 CEST
$ date -j -f %s 1433233820
Di 2 Jun 2015 10:30:20 CEST
THis console output may be related:
Error: undefined is not an object (evaluating 'inAvailData[0].timestamp')
possibly coming from https://github.com/hawkular/hawkular-charts/blob/master/src/chart/avail-chart-directive.ts#L180
Also the chart refresh does not update the time window shown - probably because https://github.com/hawkular/hawkular-charts/blob/master/src/chart/avail-chart-directive.ts#L134 sets the display range to the date range from the TransformedAvailDataPoints, but here the end of the last item never extends to "now".
More looking at the code I think the assumption is wrong that the end time is supplied and not the start time
( see comment https://github.com/hawkular/hawkular-charts/blob/master/src/chart/avail-chart-directive.ts#L187 )

