-
Epic
-
Resolution: Done-Errata
-
 Major
Major
-
None
-
GitOps monitoring dashboards in admin console
-
False
-
False
-
To Do
-
0% To Do, 0% In Progress, 100% Done
-
Goal
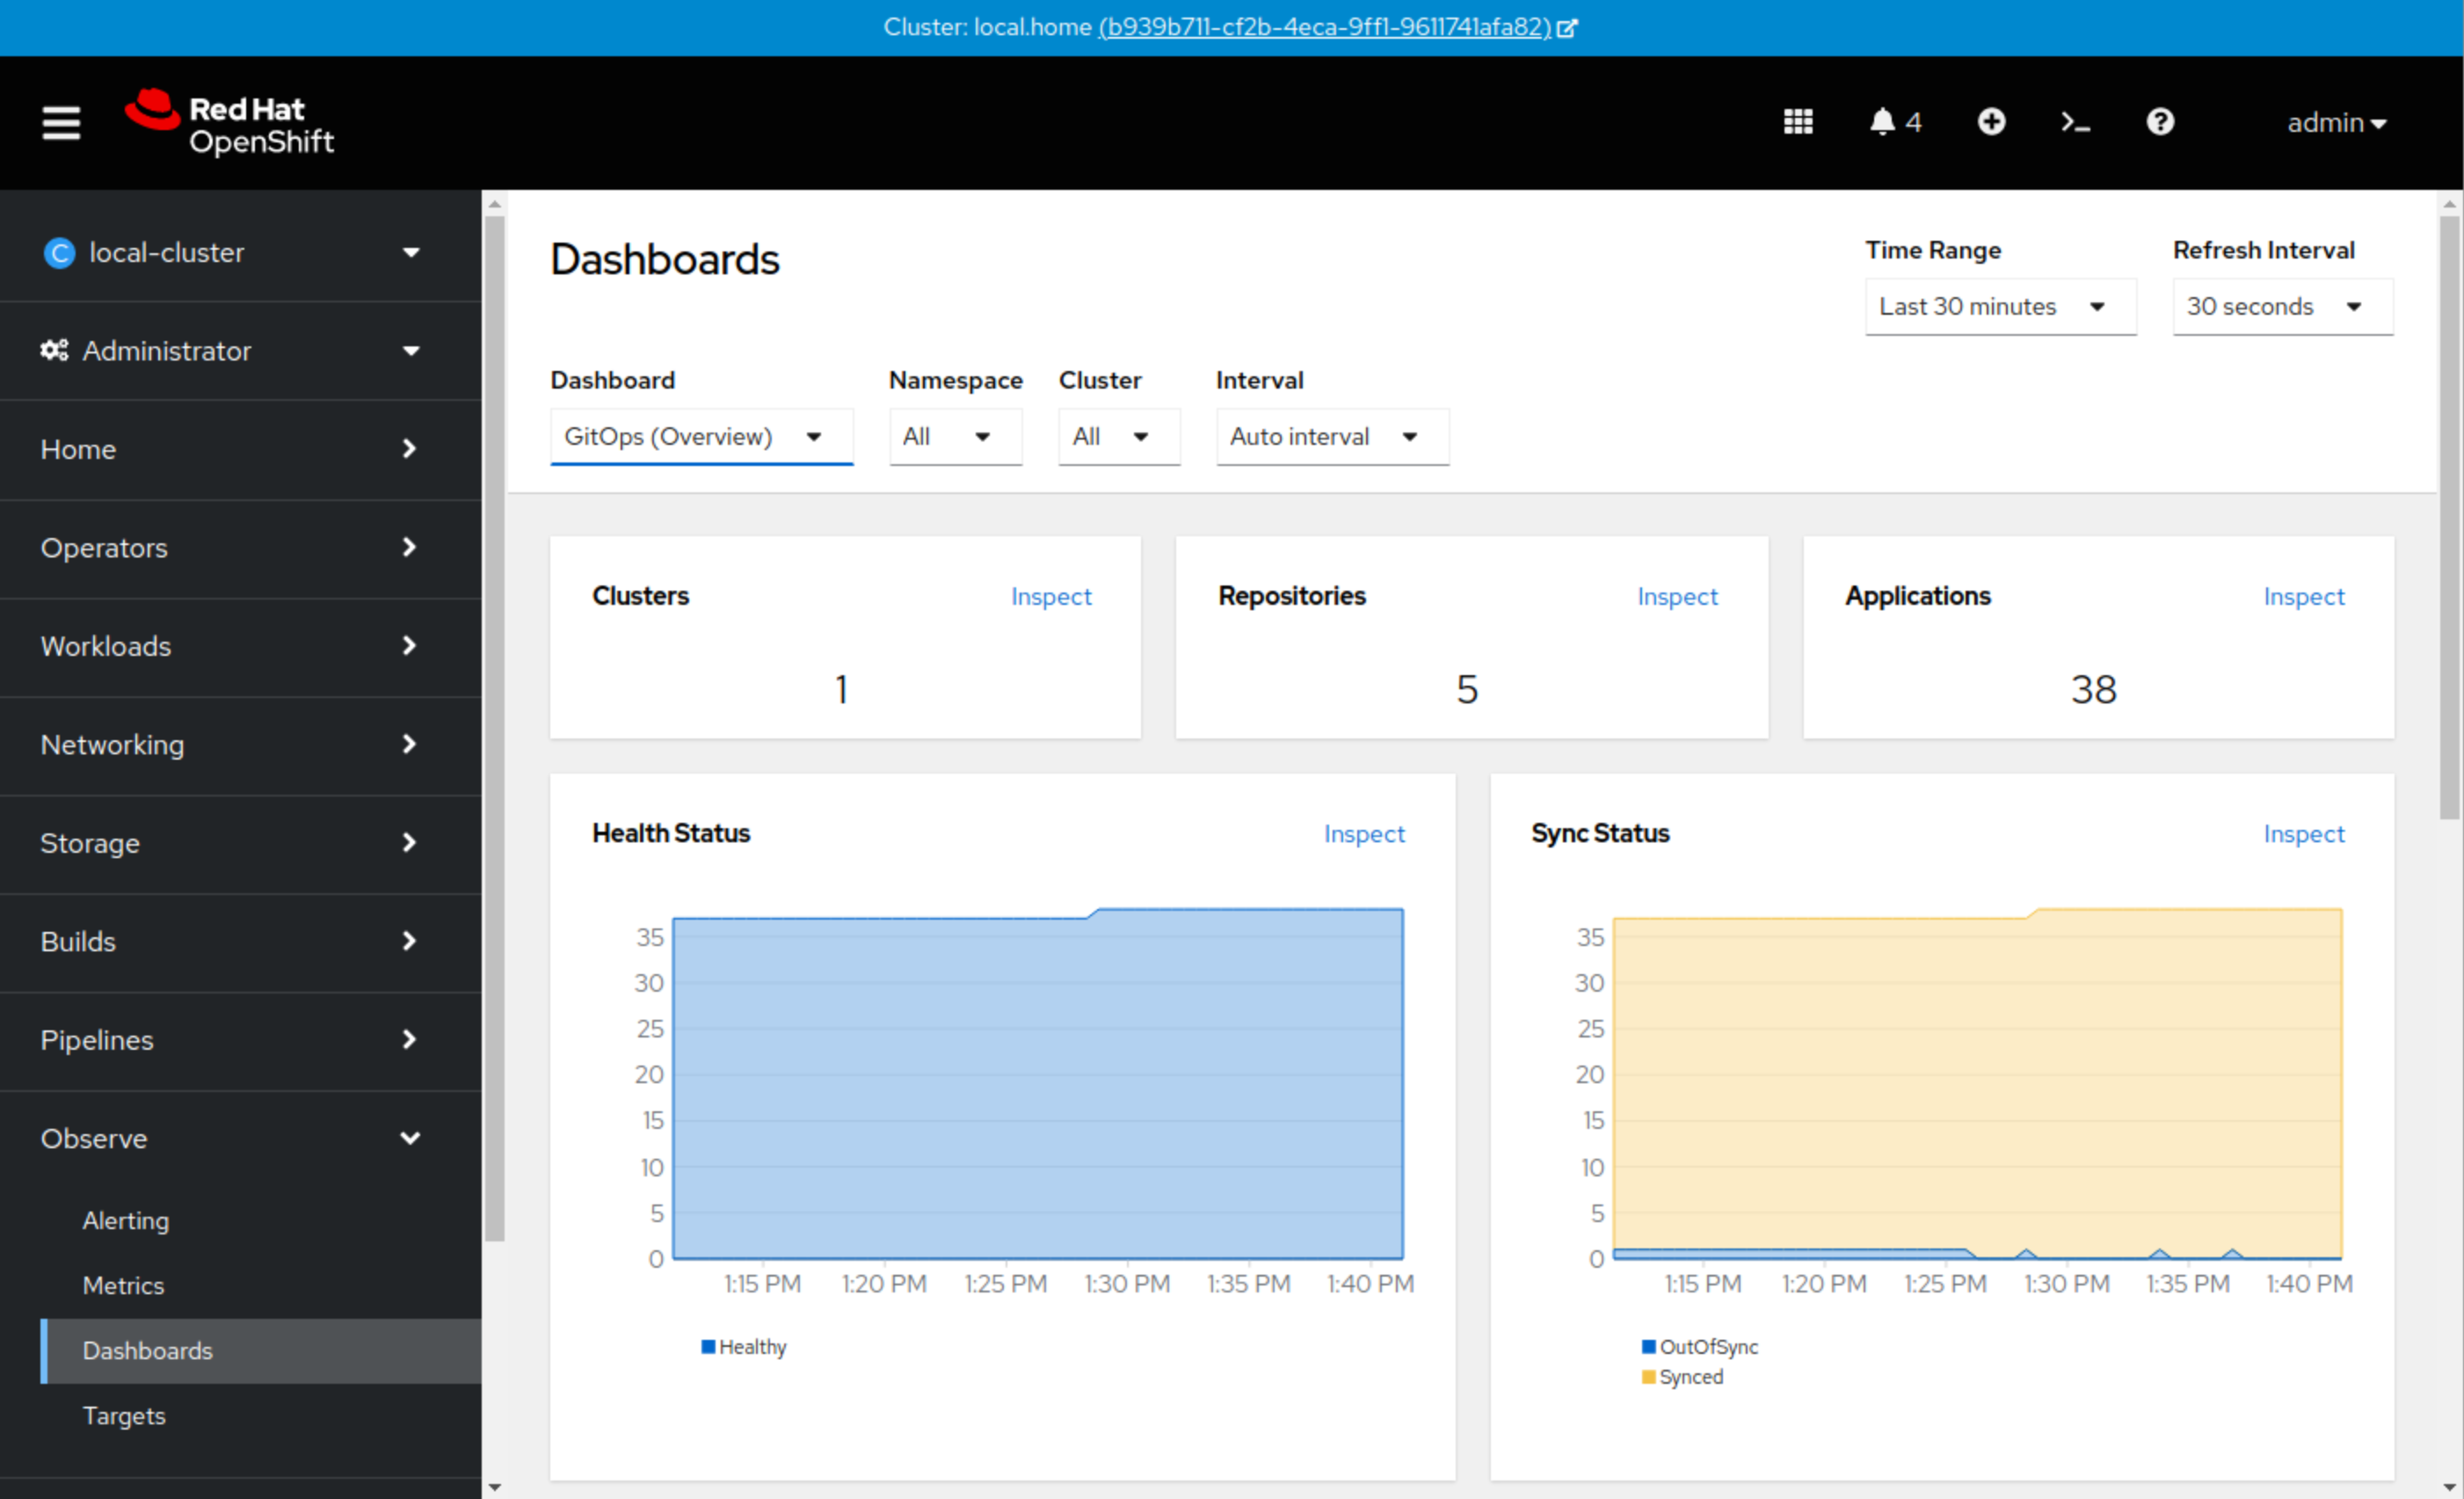
As an admin, I want to see a graphical view of the state of Argo CD instances in the Observe section of admin console so that I can gain insight how Argo CD is behaving and the usage of each instance across the cluster.
This is an example dashboard in admin console for pod resource usage:

Related Work
ACM has an example dashboard for Argo CD within the observably stack:
https://github.com/tosin2013/acm-multi-cluster-argocd-dashboard
Gerald has graciously experimented with this idea and has created some dashboards here:
https://github.com/gnunn-gitops/cluster-config/tree/main/components/configs/gitops-dashboard/base
We base our initial dashboards off of these ones.
Gerald has also put together a doc on what is currently supported in the OpenShift console for dashboards: https://docs.google.com/document/d/1UwHwkL-YtrRJYm-A922IeW3wvKEgCR-epeeeh3CBOGs/edit
Acceptance Criteria
- A monitoring dashboard is available for Argo CD instances in the Observe section of admin console
- The dashboard allows choosing namespace and specific Argo CD instance
- OpenShift only supports a subset of Grafana, so it needs its own JSON since an upstream dashboard would support more than the subset and would cause openshift to run into errors with grafana components that aren't supported.
- Implementation should NOT deploy a Grafana instance as that is not the gitops/argocd-operator's job and users do not want grafana instances deployed (it is unsupported and another component to maintain)
- The dashboard is installed when OpenShift GitOps operator gets installed. The dashboards shouldn't be optional but there needs to be a check done by the operator to make sure OpenShift monitoring is installed on the cluster. If monitoring isn't on the cluster, the dashboards should not be deployed.

- is documented by
-
RHDEVDOCS-5550 GitOps 1.10.0 release notes
-

- Closed
-
- relates to
-
-

- Closed
-
- links to
-
 RHEA-2023:120119
Errata Advisory for Red Hat OpenShift GitOps v1.10.0
RHEA-2023:120119
Errata Advisory for Red Hat OpenShift GitOps v1.10.0
- mentioned on