-
Sub-task
-
Resolution: Done
-
 Major
Major
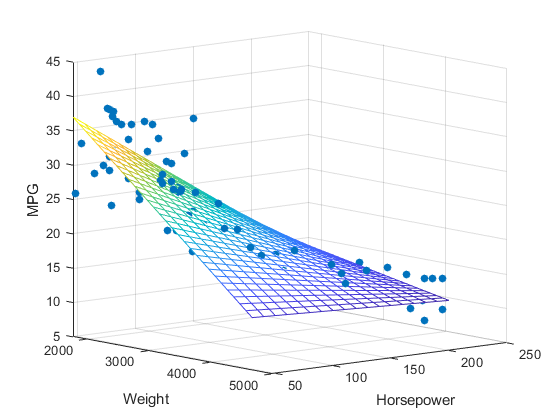
Once we have a PMML object model we need a UI component to display the Linear Regression model. This must use https://www.patternfly.org/v4/documentation/react/charts/chartline.
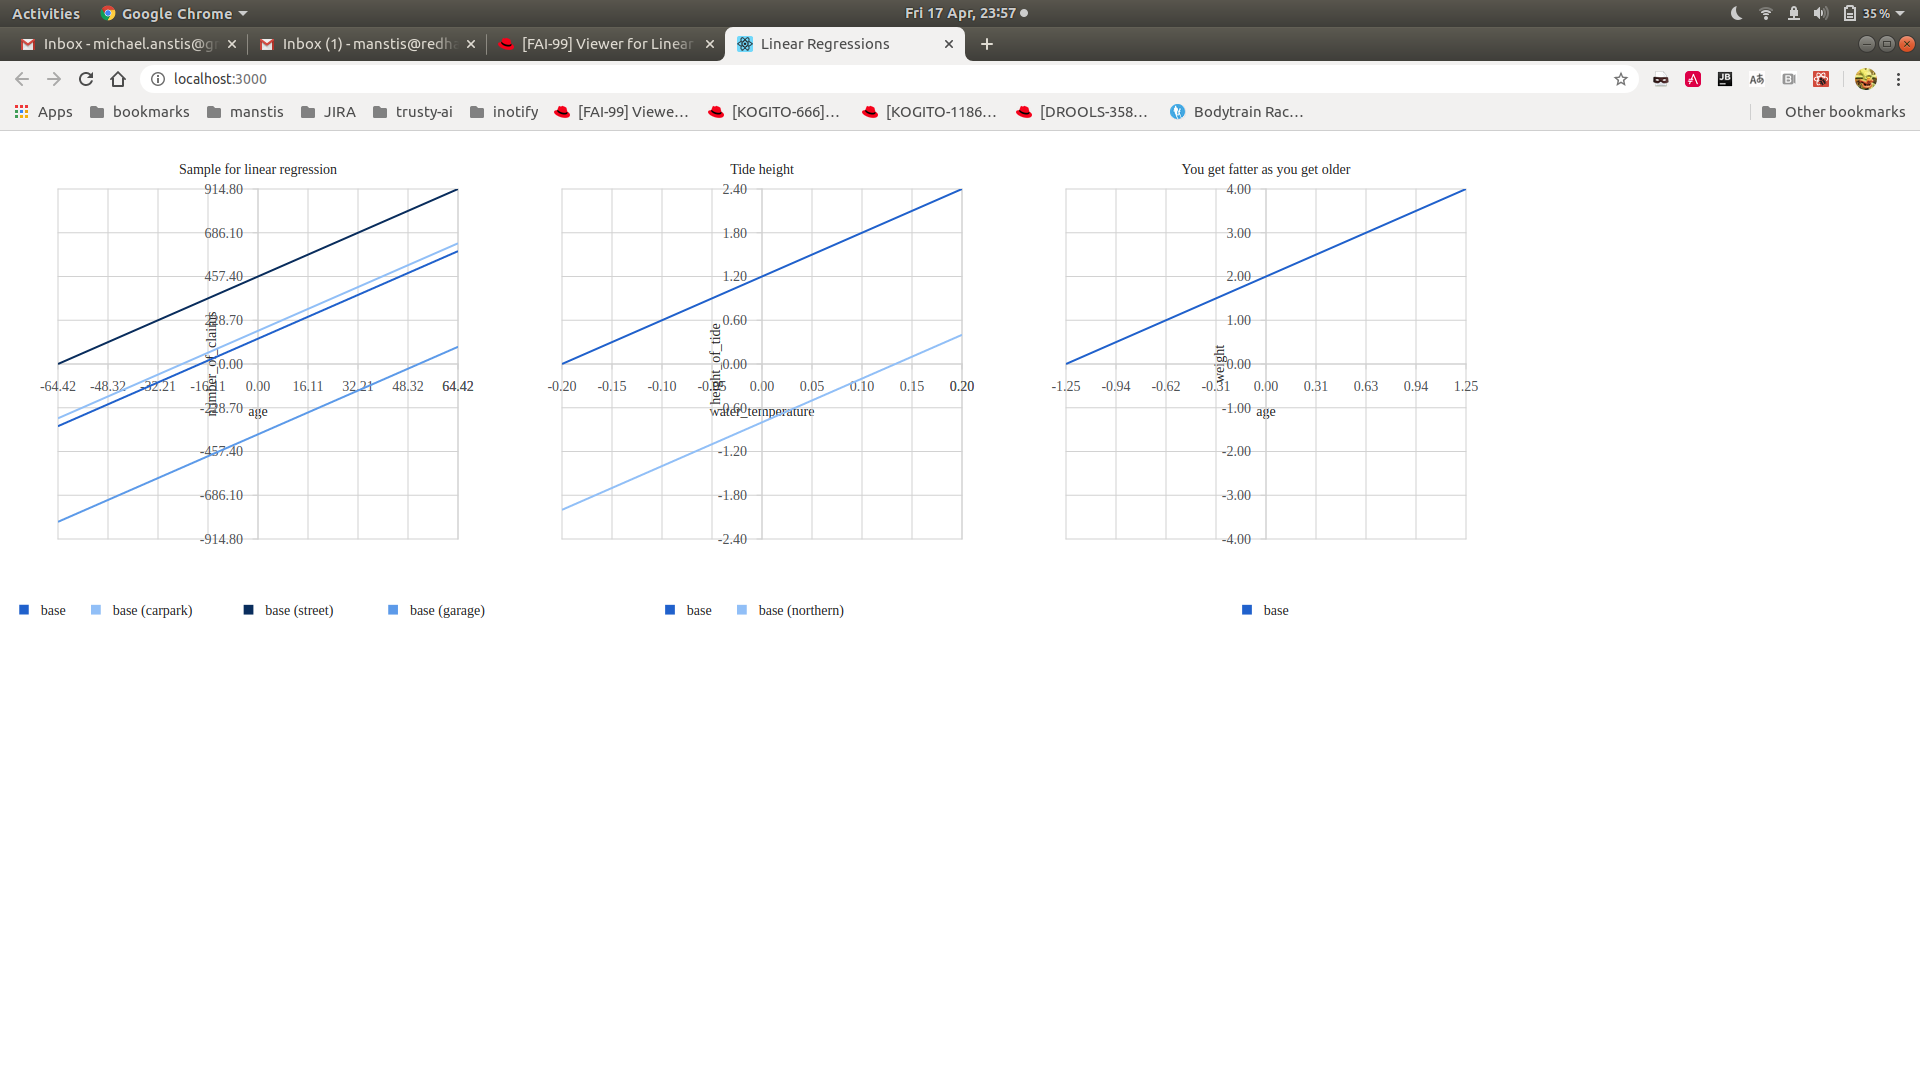
We need to consider what portion of the Linear Regression model to display and where to store this information, as the range of the axis are continuous numbers that make little sense for real application.
For example:-
- Car insurance premium goes from 0 <= premium <= 1000?
It would be meaningless showing a range -10,000 <= premium <= 10,000 - Tide height from mean goes from -2m <= height <= 2m
It would be meaningless showing a range 0 <= height <= 0.5