-
Story
-
Resolution: Done
-
 Undefined
-
None
-
None
-
None
-
Future Sustainability
-
False
-
-
False
-
5
-
None
-
None
-
ETCD Sprint 237, ETCD Sprint 240, ETCD Sprint 241, ETCD Sprint 242
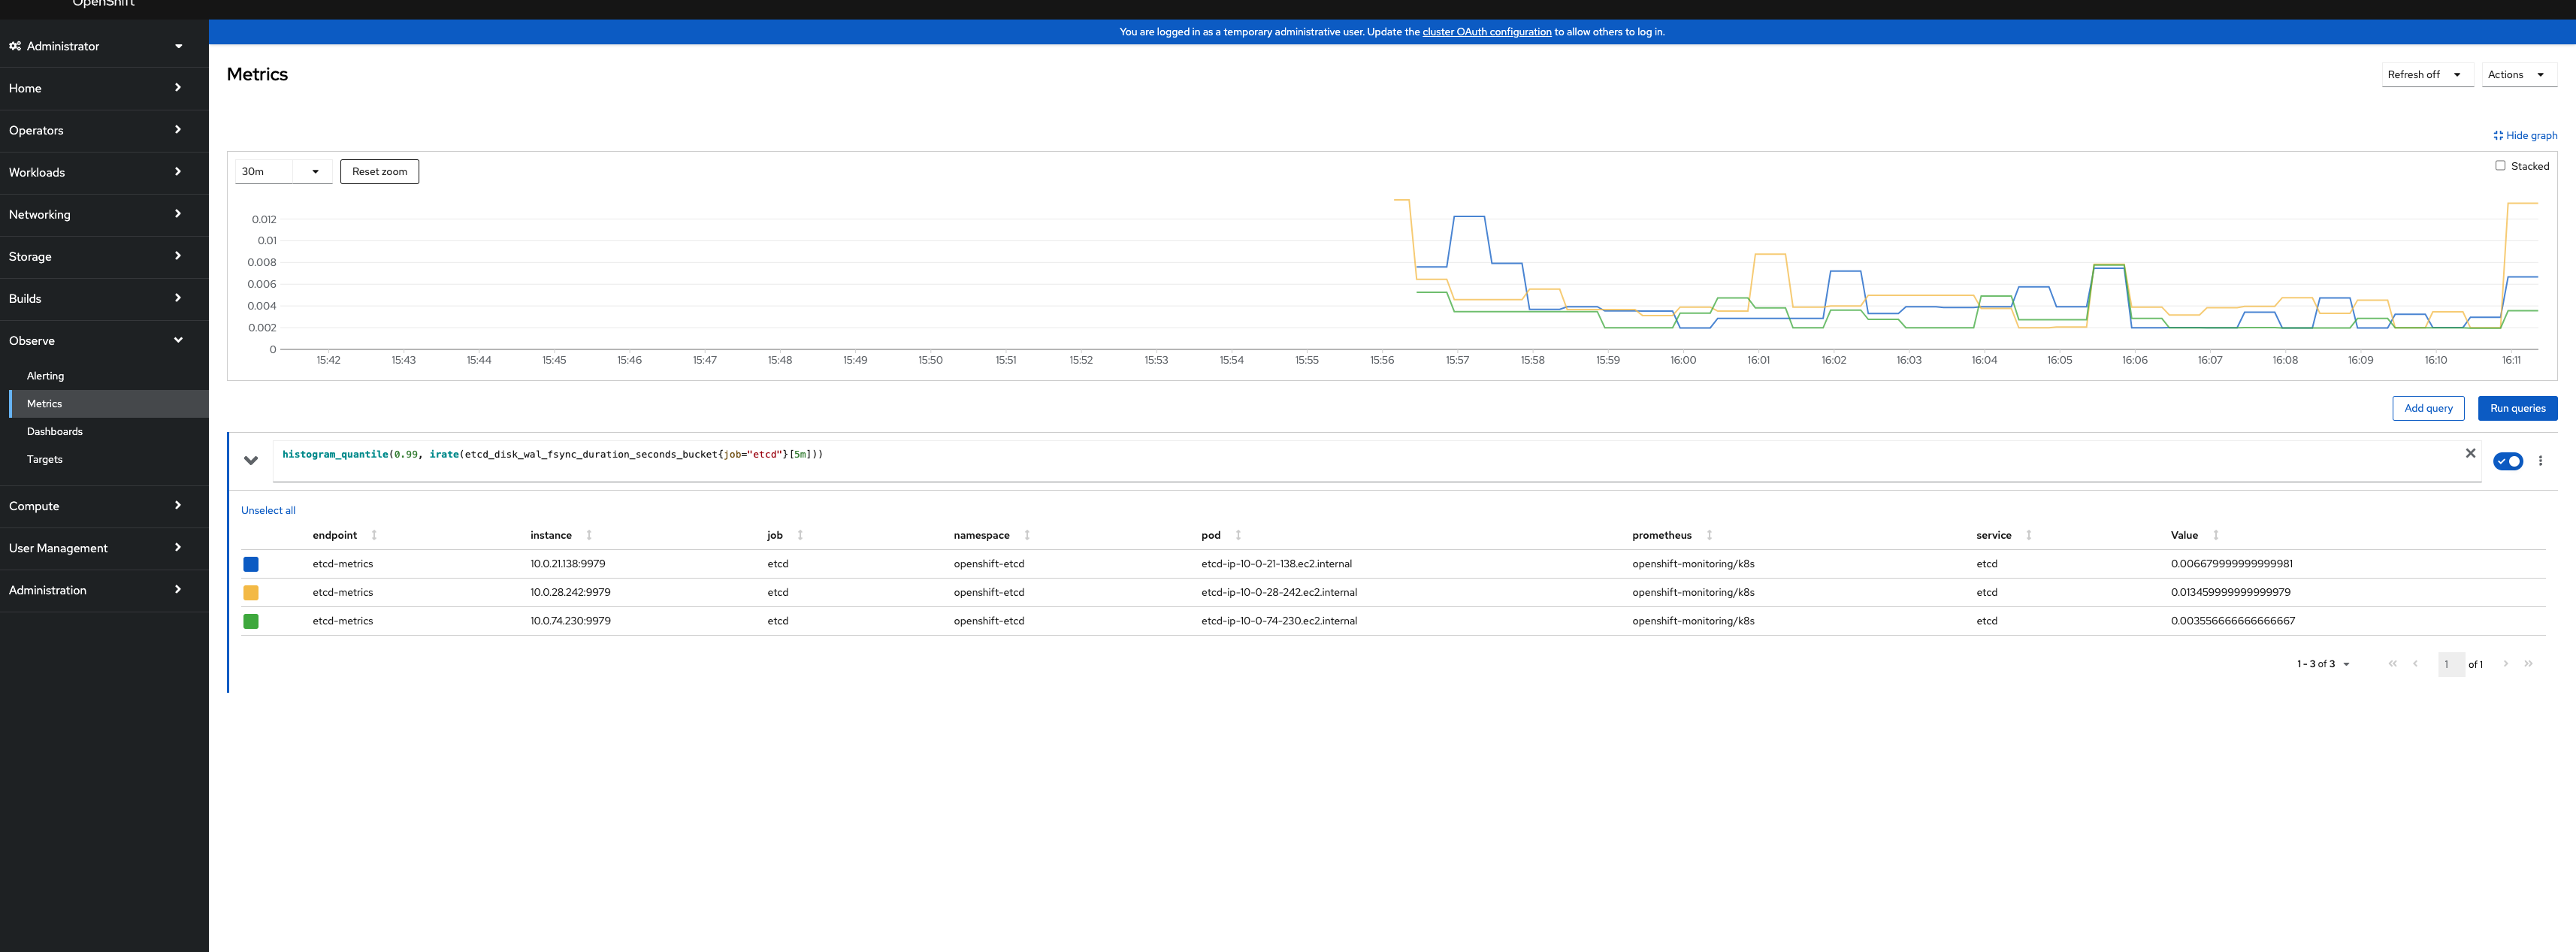
Based on the parent epic description https://issues.redhat.com/browse/ETCD-433 the following metrics should be added to the etcd metrics dashboard: https://github.com/openshift/cluster-etcd-operator/blob/master/manifests/0000_90_cluster-etcd-operator_01-dashboards.yaml
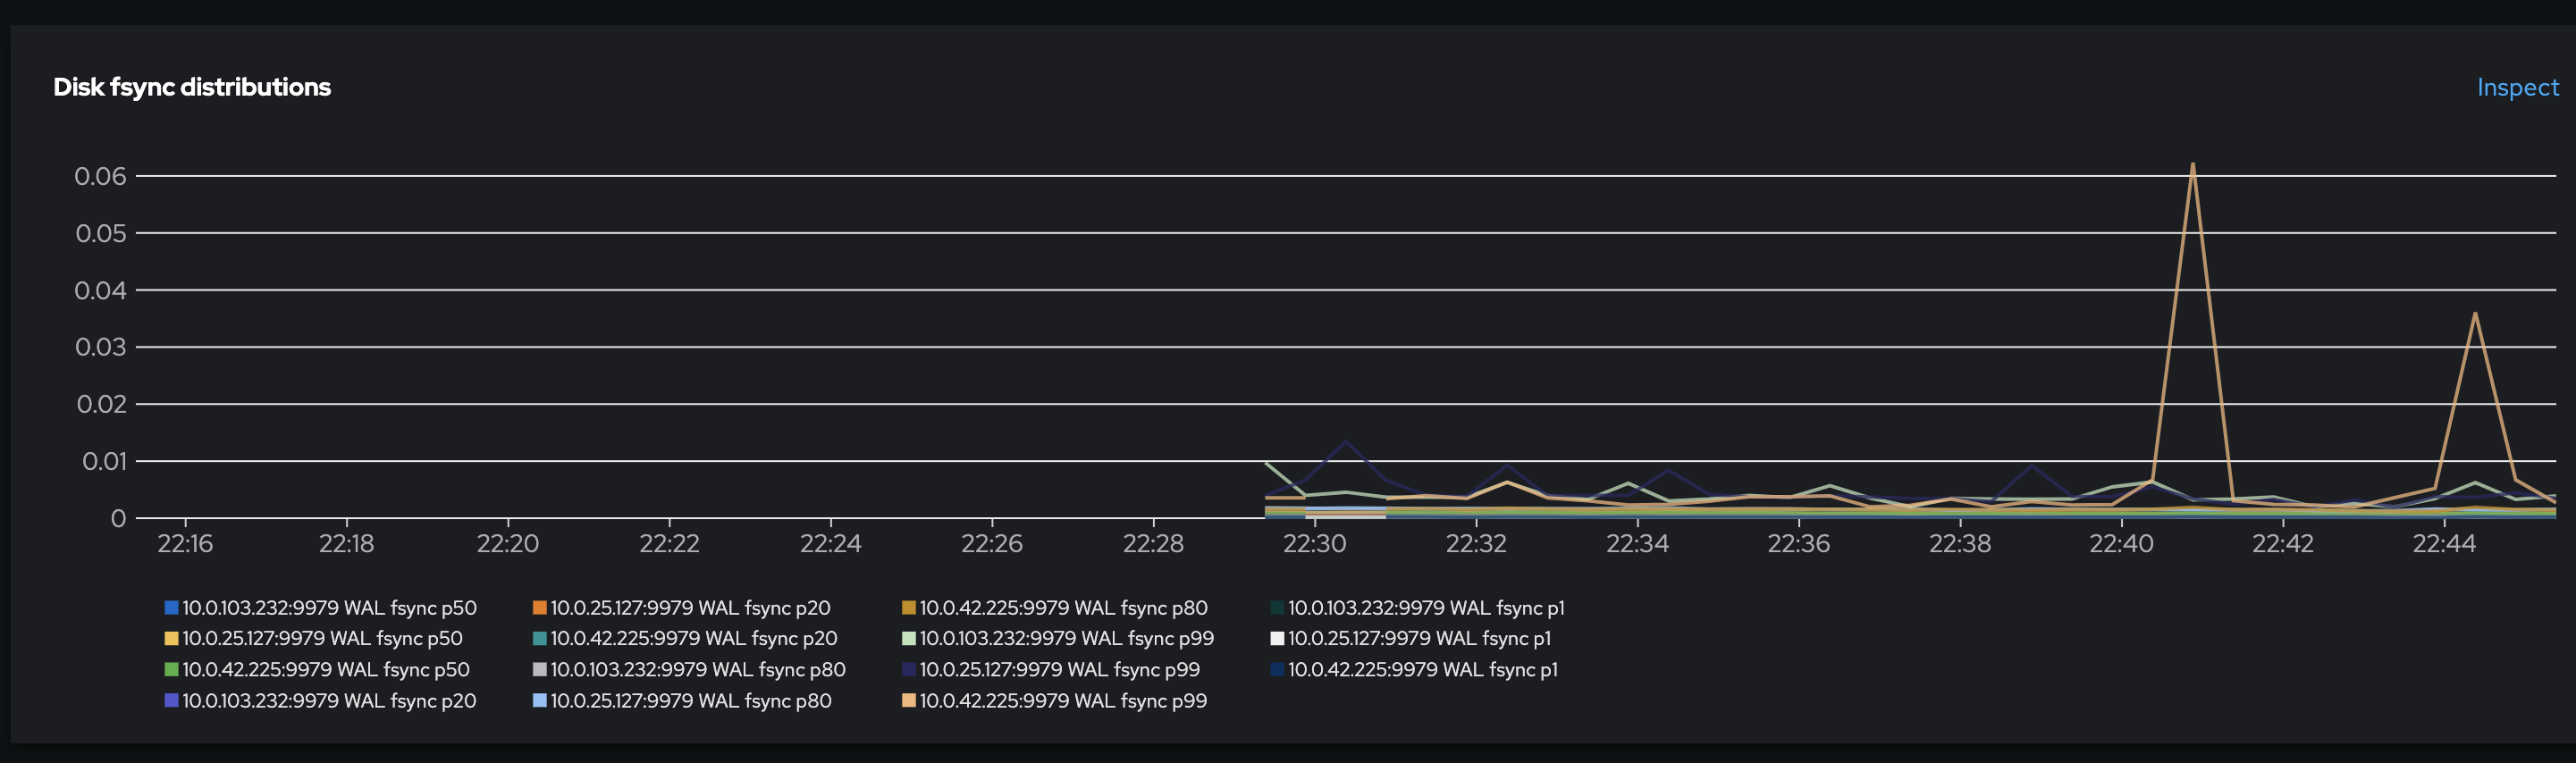
- Include a Jitter or stddev of the disk fsync duration. This would help identify problems caused by storage provided by external storage arrays, which can experience inconsistent IOPS & throughput due to the saturation of the storage network. This also helps identify storage problems resulting from the abstraction by virtualization systems which can experience saturation during certain times of the day or for certain platform conditions.
- Include a network Jitter plot as perceived by etcd. This will be the equivalent of etcd network Jitter = max(etcd RTT) - min(etcd RTT)
Some follow ups and background reading will be required to understand how best to calculate and interpret network and disk jitter.
https://prometheus.io/docs/prometheus/latest/querying/operators/#aggregation-operators
https://www.liveaction.com/blog/network-jitter/