-
Task
-
Resolution: Done
-
Major
-
None
-
False
-
False
-
Documentation (Ref Guide, User Guide, etc.)
-
Yes
-
Update the Grafana dashboard documentation
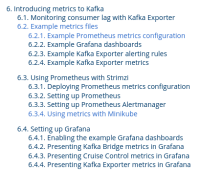
- Dashboard lists in the monitoring section need updating – explain that they are representative, not all the metrics you can get
- Spin off the metrics lists to separate section? (if retaining)
- relates to
-
ENTMQST-3213 [DOC RHEL] Document OAuth2 Prometheus metrics / dashboard
-
- Closed
-
-
ENTMQST-3320 [DOC OCP] Remove OCP 3.11 metrics content
-
- Closed
-
