-
Bug
-
Resolution: Unresolved
-
Blocker
-
None
-
None
-
None
-
NEW
-
NEW
-
---
-
---
Consistently observing OOM conditions on stand-alone KIE servers in production.
Services deployed on OpenStack 4 replicas at 6Gig memory each
<kie.version>7.59.0.Final</kie.version>
Using Drools rule template
KIE stateful session persistence enabled.
<kmodule xmlns="http://www.drools.org/xsd/kmodule" xmlns:xsi="http://www.w3.org/2001/XMLSchema-instance"> <kbase name="ves" default="true" eventProcessingMode="stream" equalsBehavior="identity" packages="xx.xxx.xxx.dmssn.log.dampening.kjar"> <ruleTemplate dtable="xx.xxx.xxx/dmssn/log/dampening/kjar/logdampeningTemplates.xls" template="xx.xxx.xxx/dmssn/log/dampening/kjar/logdampeningTemplateRules.drt" row="2" col="1"/> <ksession name="ves" type="stateful" default="true" clockType="realtime" /> </kbase></kmodule>
Service consume from Kafka topic. Load is approximately 167 TPS with spikes.
Observing working memory object counts consistently increasing. Heap observation shows heap consistently increases until heap exhausted. GC does not have any impact; appears that there are very few objects eligible for collection. OOM occurs even when no rules fire.
Several attempts to reduce memory footprint including reducing size of rule set by 98%.
Persistence is now disabled yet continue to observe OOM conditions. The condition has been recreated in preprod environments. Heap is exhausted even when no facts match rule conditions.
Adding more memory and replicas has no impact.
Appears to be a memory leak. We suspect that implicit event retraction may not be releasing resources. Heap dump should provide more information.
In the process of generating heap dump for analysis.
Issue has significant impact on production fault pipelines. No workaround exists for this issue. Pods crash loop and restart.
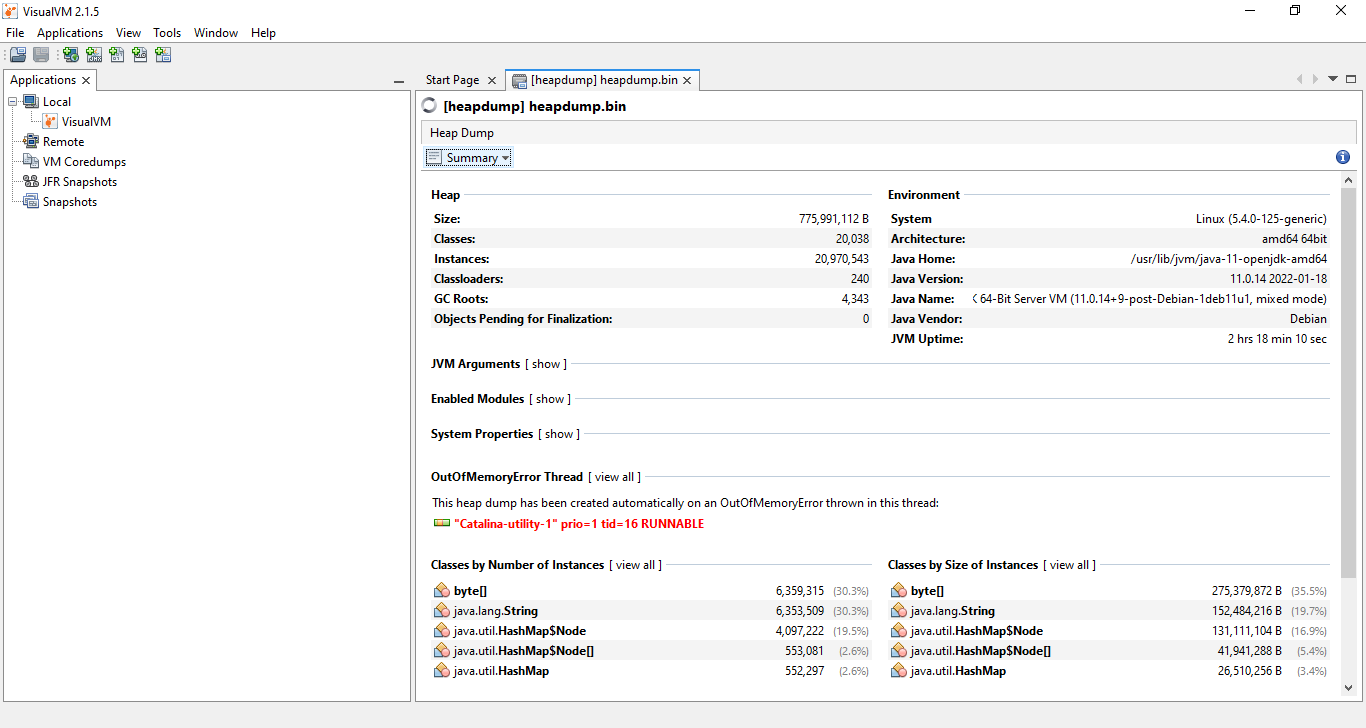
VisualVM Summary - Preprod Env OOM

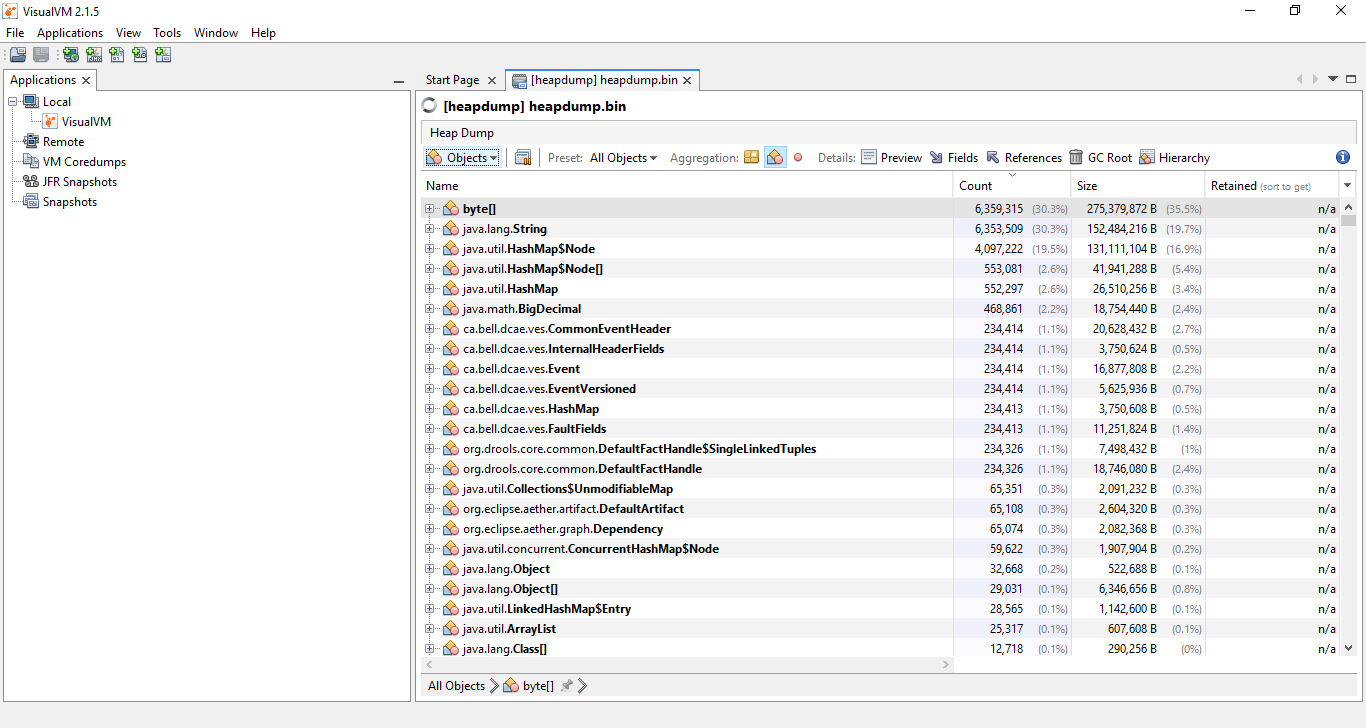
Top Objects


