-
Bug
-
Resolution: Won't Do
-
 Major
Major
-
None
-
7.17.0.Final
-
None
-
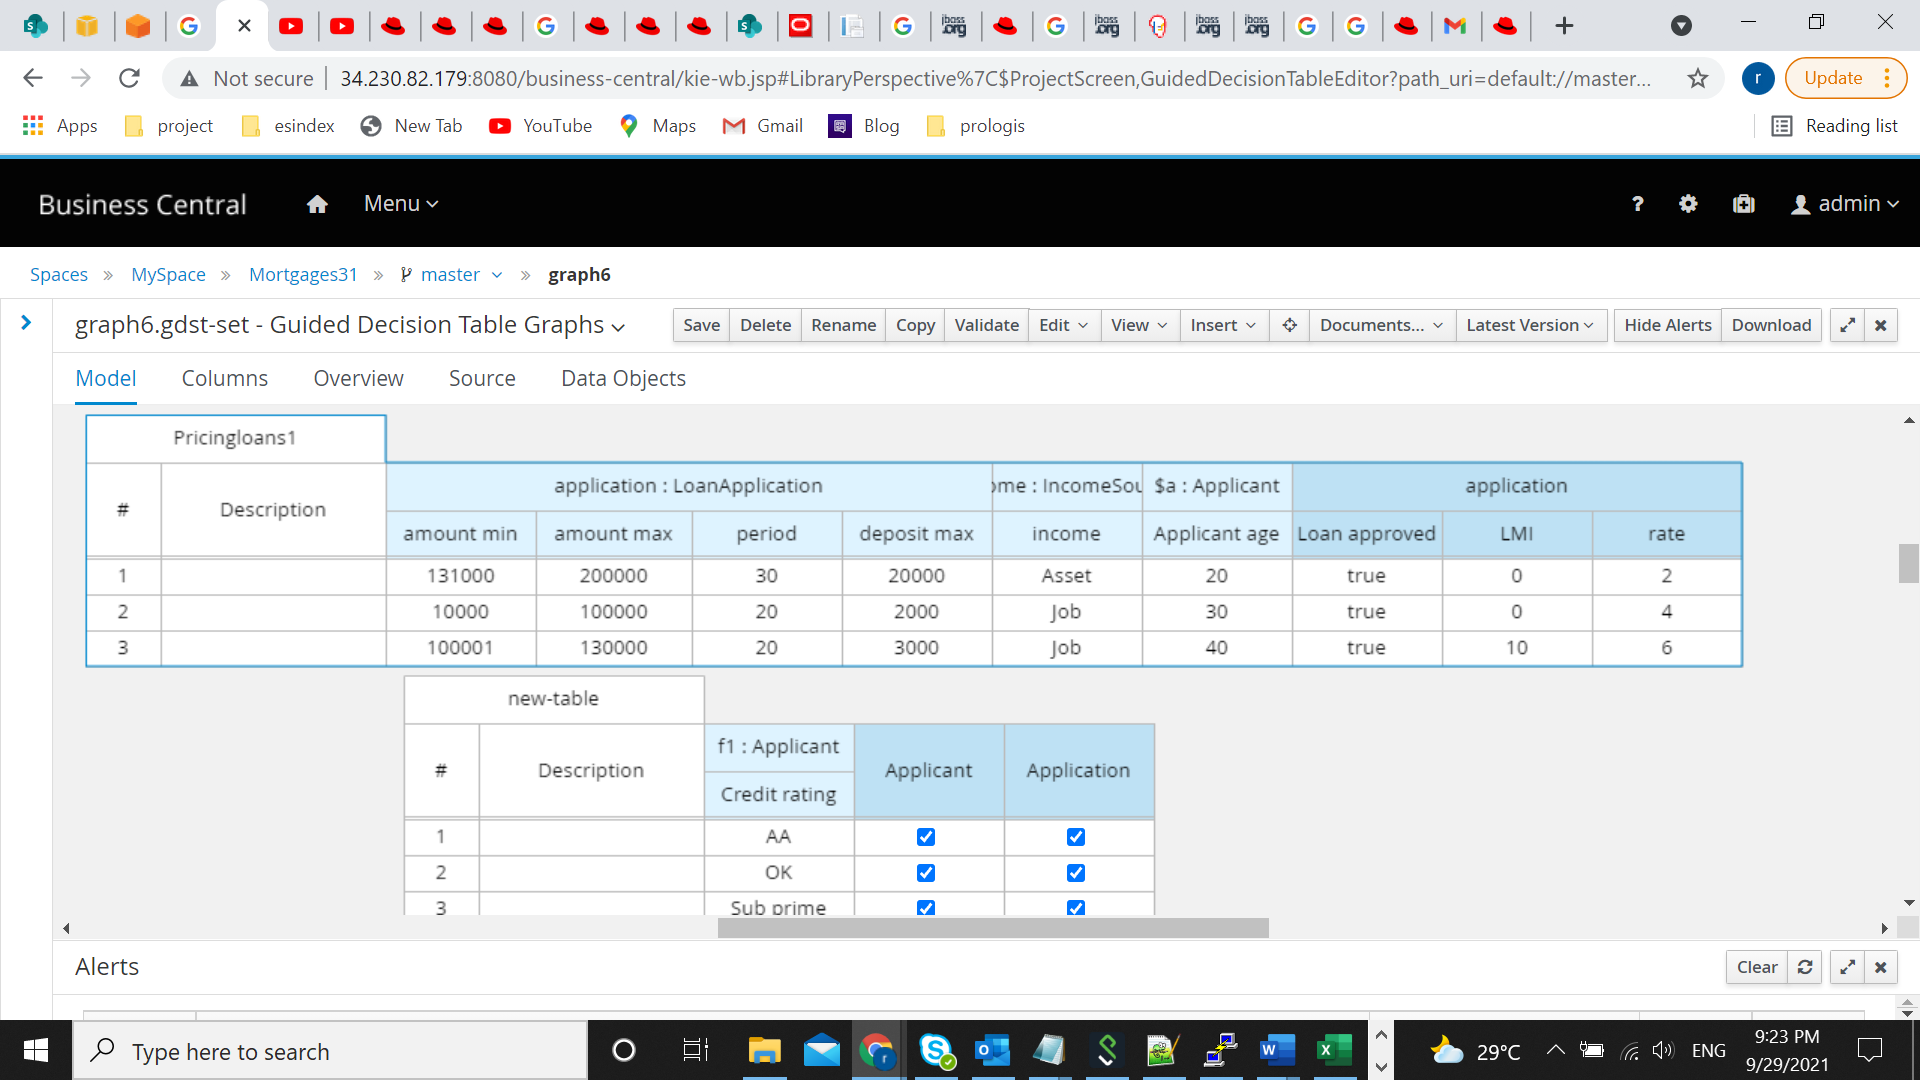
- Import "mortgages" example
- create new-table guided decision table
- Add new asset -> Guided Decision Table Graph
- Documents -> Open -> Pricing Loans, new-table
- new graph is created but the two decision tables are linked
Issue:
drools guided decision table graphs does not alter base table(Pricingloans1) action based on conditions of related table(new-table), it visually display’s the relation and does not alter the content.
Description
Users are no longer able to create Guided Decision Table Graphs with decision tables linked
Manual Test

- Open sample Mortgages
- create new decision table new-table as per drools documentation (https://docs.drools.org/7.17.0.Final/drools-docs/html_single/#_drools.guideddecisiontablegrapheditor)
- Crete new graph
- Open existing 'Pricing Loans', new-table
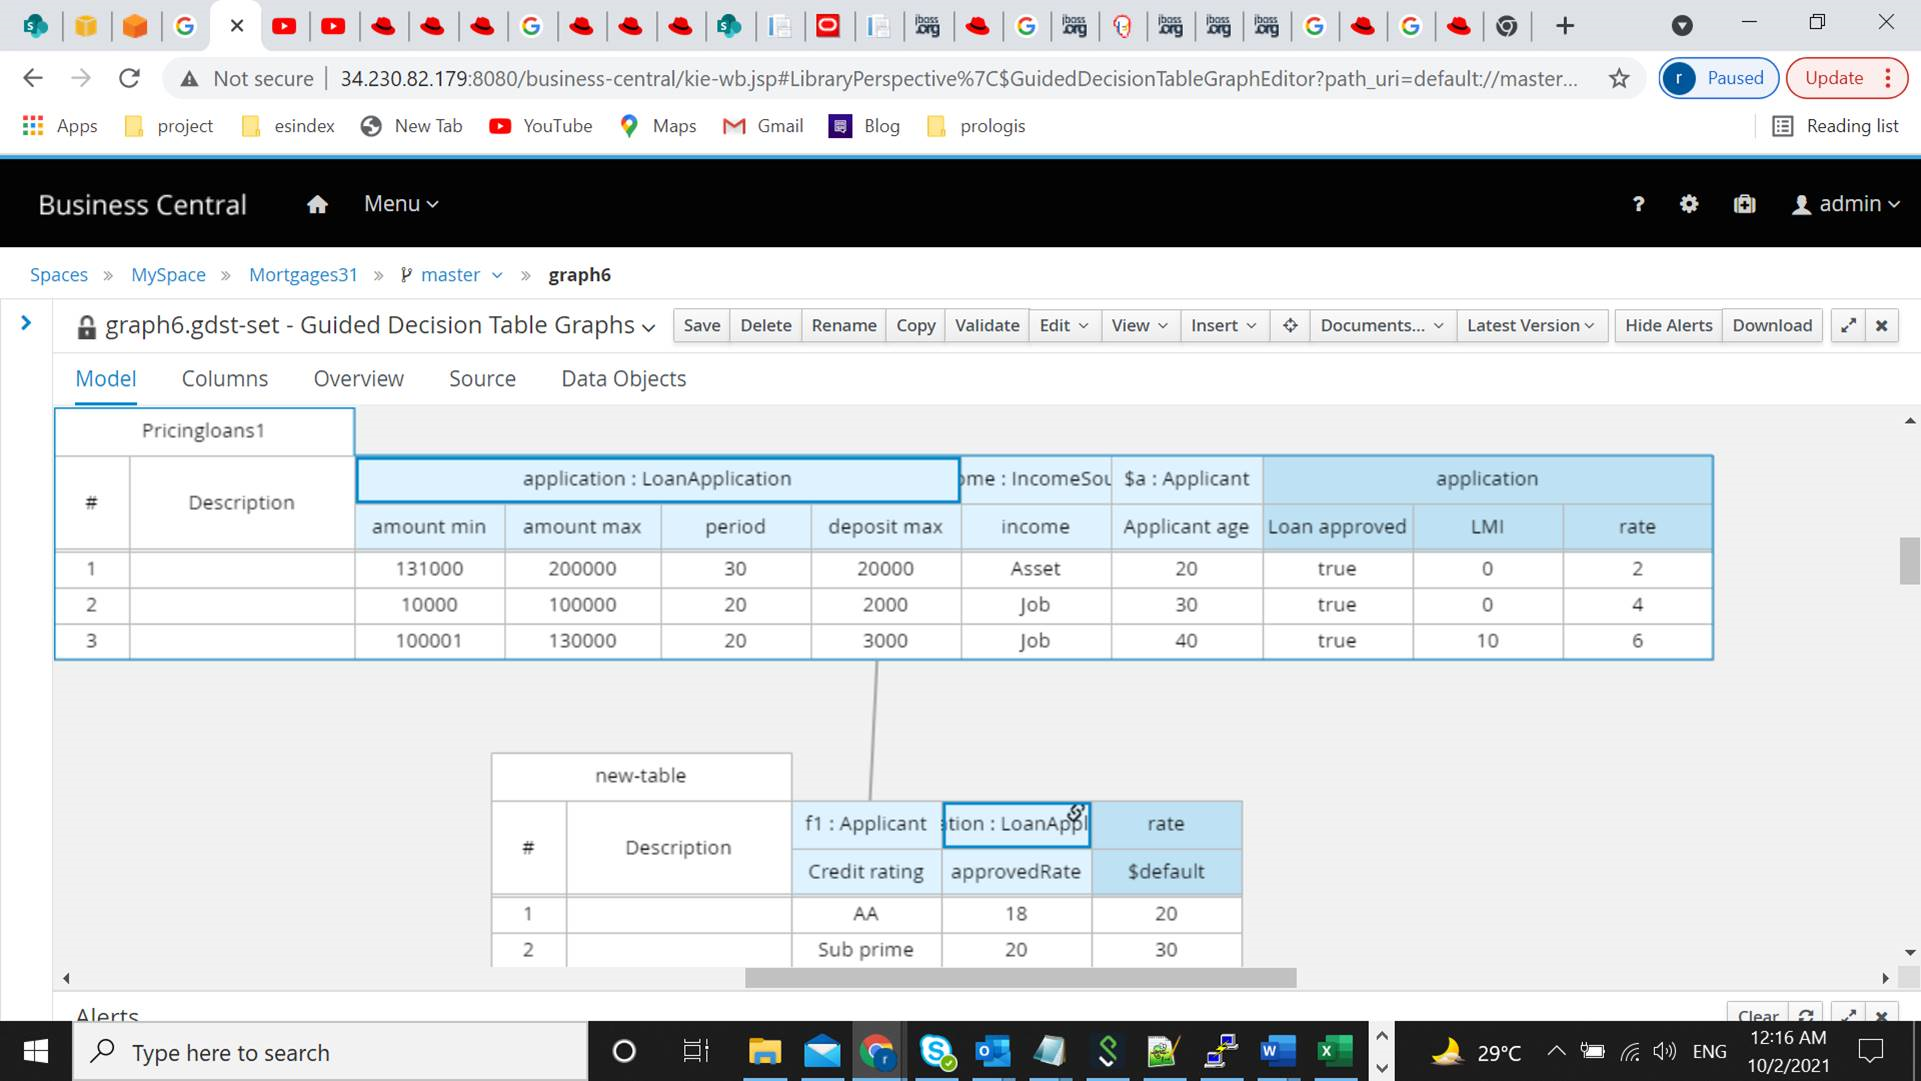
- new guided decision table graph is created and two decision tables are not linked as shown in documentation
- attached screenshot
Issue:
So drools guided decision table graphs does not alter base table action based on conditions of related table, it visually display’s the relation and does not alter the content.
attached the screenshot.
But when I see the source generated it just provides details of just one table. In the above case new-table, there is no details of other table Pricingloans1
package mortgages.mortgages;
//from row number: 1
rule "Row 1 new-table"
dialect "mvel"
when
f1 : Applicant( creditRating == "AA" )
application : LoanApplication( approvedRate > 18 )
then
application.setApprovedRate( 20 );
end
//from row number: 2
rule "Row 2 new-table"
dialect "mvel"
when
f1 : Applicant( creditRating == "Sub prime" )
application : LoanApplication( approvedRate > 20 )
then
application.setApprovedRate( 30 );
end
//from row number: 3
rule "Row 3 new-table"
dialect "mvel"
when
f1 : Applicant( creditRating == "Sub prime" )
application : LoanApplication( approvedRate > 30 )
then
application.setApprovedRate( 40 );
end
Clarification: can you confirm that the functionality of merging two tables with graphs supported or it is just visual link displayed to show relation between two tables.
Import "mortgages" example create new-table guided decision table Add new asset -> Guided Decision Table Graph Documents -> Open -> Pricing Loans, new-table new graph is created but the two decision tables are linked Issue: drools guided decision table graphs does not alter base table(Pricingloans1) action based on conditions of related table(new-table), it visually display’s the relation and does not alter the content. Description Users are no longer able to create Guided Decision Table Graphs with decision tables linked Manual Test Open sample Mortgages create new decision table new-table as per drools documentation ( https://docs.drools.org/7.17.0.Final/drools-docs/html_single/#_drools.guideddecisiontablegrapheditor ) Crete new graph Open existing 'Pricing Loans', new-table new guided decision table graph is created and two decision tables are not linked as shown in documentation attached screenshot Issue: So drools guided decision table graphs does not alter base table action based on conditions of related table, it visually display’s the relation and does not alter the content. attached the screenshot. But when I see the source generated it just provides details of just one table. In the above case new-table, there is no details of other table Pricingloans1 package mortgages.mortgages; //from row number: 1 rule "Row 1 new-table" dialect "mvel" when f1 : Applicant( creditRating == "AA" ) application : LoanApplication( approvedRate > 18 ) then application.setApprovedRate( 20 ); end //from row number: 2 rule "Row 2 new-table" dialect "mvel" when f1 : Applicant( creditRating == "Sub prime" ) application : LoanApplication( approvedRate > 20 ) then application.setApprovedRate( 30 ); end //from row number: 3 rule "Row 3 new-table" dialect "mvel" when f1 : Applicant( creditRating == "Sub prime" ) application : LoanApplication( approvedRate > 30 ) then application.setApprovedRate( 40 ); end Clarification: can you confirm that the functionality of merging two tables with graphs supported or it is just visual link displayed to show relation between two tables. -
NEW
-
NEW
Users are no longer able to create Guided Decision Table Graphs with decision tables linked
Manual Test
- Open sample Mortgages
- create new decision table new-table as per drools documentation (https://docs.drools.org/7.17.0.Final/drools-docs/html_single/#_drools.guideddecisiontablegrapheditor)
- Crete new graph
- Open existing 'Pricing Loans', new-table
- new guided decision table graph is created and two decision tables are not linked as shown in documentation
- attached screenshot
Issue:
So drools guided decision table graphs does not alter base table action based on conditions of related table, it visually display’s the relation and does not alter the content.
attached the screenshot.
But when I see the source generated it just provides details of just one table. In the above case new-table, there is no details of other table Pricingloans1
package mortgages.mortgages;
//from row number: 1
rule "Row 1 new-table"
dialect "mvel"
when
f1 : Applicant( creditRating == "AA" )
application : LoanApplication( approvedRate > 18 )
then
application.setApprovedRate( 20 );
end
//from row number: 2
rule "Row 2 new-table"
dialect "mvel"
when
f1 : Applicant( creditRating == "Sub prime" )
application : LoanApplication( approvedRate > 20 )
then
application.setApprovedRate( 30 );
end
//from row number: 3
rule "Row 3 new-table"
dialect "mvel"
when
f1 : Applicant( creditRating == "Sub prime" )
application : LoanApplication( approvedRate > 30 )
then
application.setApprovedRate( 40 );
end
Clarification: can you confirm that the functionality of merging two tables with graphs supported or it is just visual link displayed to show relation between two tables.
