-
Bug
-
Resolution: Obsolete
-
Major
-
1.9.7.Final
-
False
-
-
False
-
Moderate
Bug report
What Debezium connector do you use and what version?
Debezium connector: io.debezium.connector.mysql.MySqlConnector
Debezium connector version: 1.9.7.final
Prometheus: 2.43.0
Grafana: 9.4.7
What is the connector configuration?
{
"name": "external-mysql-inventory-connector",
"config": {
"connector.class": "io.debezium.connector.mysql.MySqlConnector",
"tasks.max": "1",
"database.hostname": "mysql_db_host",
"database.port": "mysql_db_port",
"database.user": "mysql_db_user",
"database.password": "mysql_db_password",
"database.server.id": "$randomInt$randomInt",
"database.server.name": "mysql_server_name",
"database.include.list": "mysql_db_name",
"database.history.kafka.bootstrap.servers": "kafka_host",
"database.allowPublicKeyRetrieval": true,
"database.history.kafka.topic": "mysql_server_name.mysql_db_name.mysql_history_table_name",
"snapshot.mode": "initial",
"signal.data.collection": "mysql_db_name.mysql_signal_table_name",
"signal.kafka.topic": "mysql_server_name.mysql_db_name.mysql_signal_table_name",
"key.converter": "org.apache.kafka.connect.json.JsonConverter",
"value.converter": "org.apache.kafka.connect.json.JsonConverter",
"value.converter.schemas.enable": false,
"key.converter.schemas.enable": false
}
}
What is the captured database version and mode of deployment?
MySQL 8.0.32 standalone
Local docker container environment
What behaviour do you expect?
I am testing debezium metrics with prometheus and grafana.
As CreateEvents should be a subset of Events. When we insert some data, both totalNumberOfEventsSeen and totalNumberOfCreateEventSeen should have the corresponding increment, and the totalNumberOfEventsSeen should be greater or equal to the totalNumberOfCreateEventSeen.
What behaviour do you see?
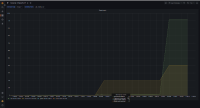
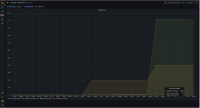
The totalNumberOfEventSeen does not have the corresponding increment, and the totalNumberOfEventSeen is less than totalNumberOfCreateEventSeen.
How to reproduce the issue using our tutorial deployment?
1. git clone and docker-compose up from [Debezium monitoring|https://github.com/debezium/debezium-examples/tree/main/monitoring,] using version 1.9.7.final.
2. Login in Grafana.
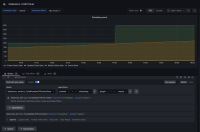
3. Add 2 metrics `debezium_metrics_TotalNumberOfEventsSeen` and `debezium_metrics_TotalNumberOfCreateEventsSeen` to dashboard
4. Insert data into MySQL database.
5. We can observe that the debezium_metrics_TotalNumberOfCreateEventsSeen have the corresponding increment but not for debezium_metrics_TotalNumberOfEventsSeen and the debezium_metrics_TotalNumberOfCreateEventsSeen is larger than debezium_metrics_TotalNumberOfEventsSeen.
- account is impacted by
-
DBZ-7912 The explanation in the documentation is insufficient - metric
-
- Closed
-


