-
Bug
-
Resolution: Can't Do
-
Undefined
-
None
-
None
-
None
-
None
Description
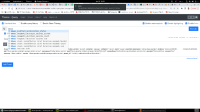
The metric 'dbaas_requests_error_count' is not displayed in Thanos
Steps to reproduce:
- Make sure you have reached the maximum number of instances in an ISV (i.e. Cockroach)
- Create a new instance in the ISV that reached it's instances limit
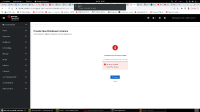
- Make sure you get an error message in RHODA (A screenshot attatched)
Expected result:
The metric 'dbaas_requests_error_count' will appear in Thanos and it will be possible to see an error under resource='dbaas_instance'
Actual result:
The metric is not displayed in Thanos.
**Happens also with an unsuccessful import of a provider account
Environment:
https://console-openshift-console.apps.ik-metrics-test.w9sh.s1.devshift.org/
username: htpasswd-cluster-admin-user
password: Redhat@321
Thanos URL: http://thanos-observatorium.apps.mmikhail-obs1.kni.syseng.devcluster.openshift.com/graph?g0.expr=dbaas_requests_duration_seconds_sum%7Bresource%3D%22dbaas_platform%22%7D&g0.tab=1&g0.stacked=0&g0.range_input=1h&g0.max_source_resolution=0s&g0.deduplicate=1&g0.partial_response=0&g0.store_matches=%5B%5D
- is cloned by
-
DBAAS-1195 DBaaS Inventory Status Gauge data not appearing in Metrics and Grafana
-
- Closed
-

