Uploaded image for project: 'Cost Management'
  1. Cost Management
  2. COST-5116

ROS GA: Adjust chart's y-domain for box plot

XMLWordPrintable

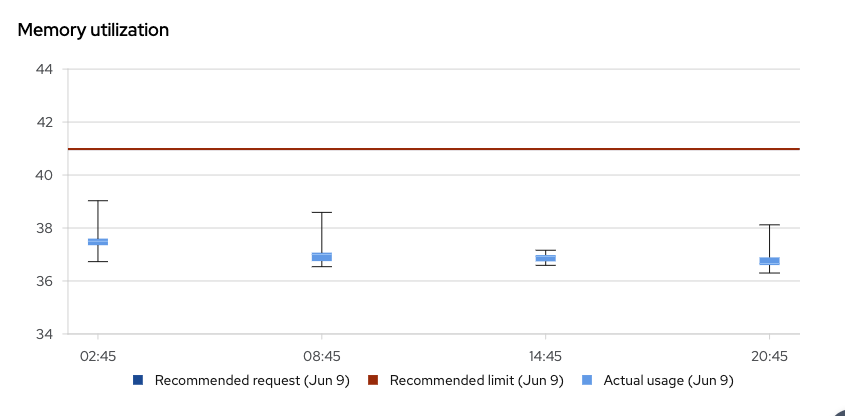
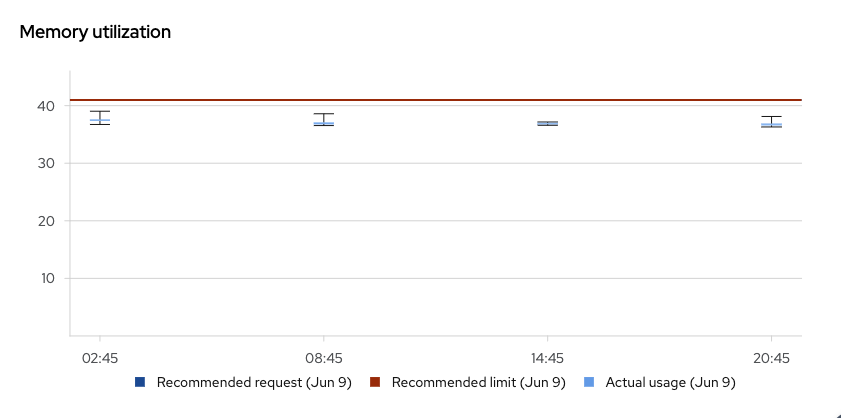
      Adjust the box plot's scale so small value differences are more visible. For example, instead of starting the y-axis at zero, we can use the dataset's min and max values for the y-domain.

      Before

      After

        1. after 11.20.12 AM.png
          26 kB
          Daniel Labrecque
        2. before 11.20.09 AM.png
          25 kB
          Daniel Labrecque
        3. image-2024-06-11-18-31-01-681.png
          185 kB
          Yash Ajgaonkar

            dlabrecq@redhat.com Daniel Labrecque
            dlabrecq@redhat.com Daniel Labrecque
            Yash Ajgaonkar Yash Ajgaonkar
            Votes:
            0 Vote for this issue
            Watchers:
            8 Start watching this issue

              Created:
              Updated:
              Resolved: