Uploaded image for project: 'Cost Management'
  1. Cost Management
  2. COST-2363

Bullet chart requests shown as range for no capacity

XMLWordPrintable

    • Icon: Bug Bug
    • Resolution: Done
    • Icon: Normal Normal
    • 2022Q1
    • None
    • UI
    • None

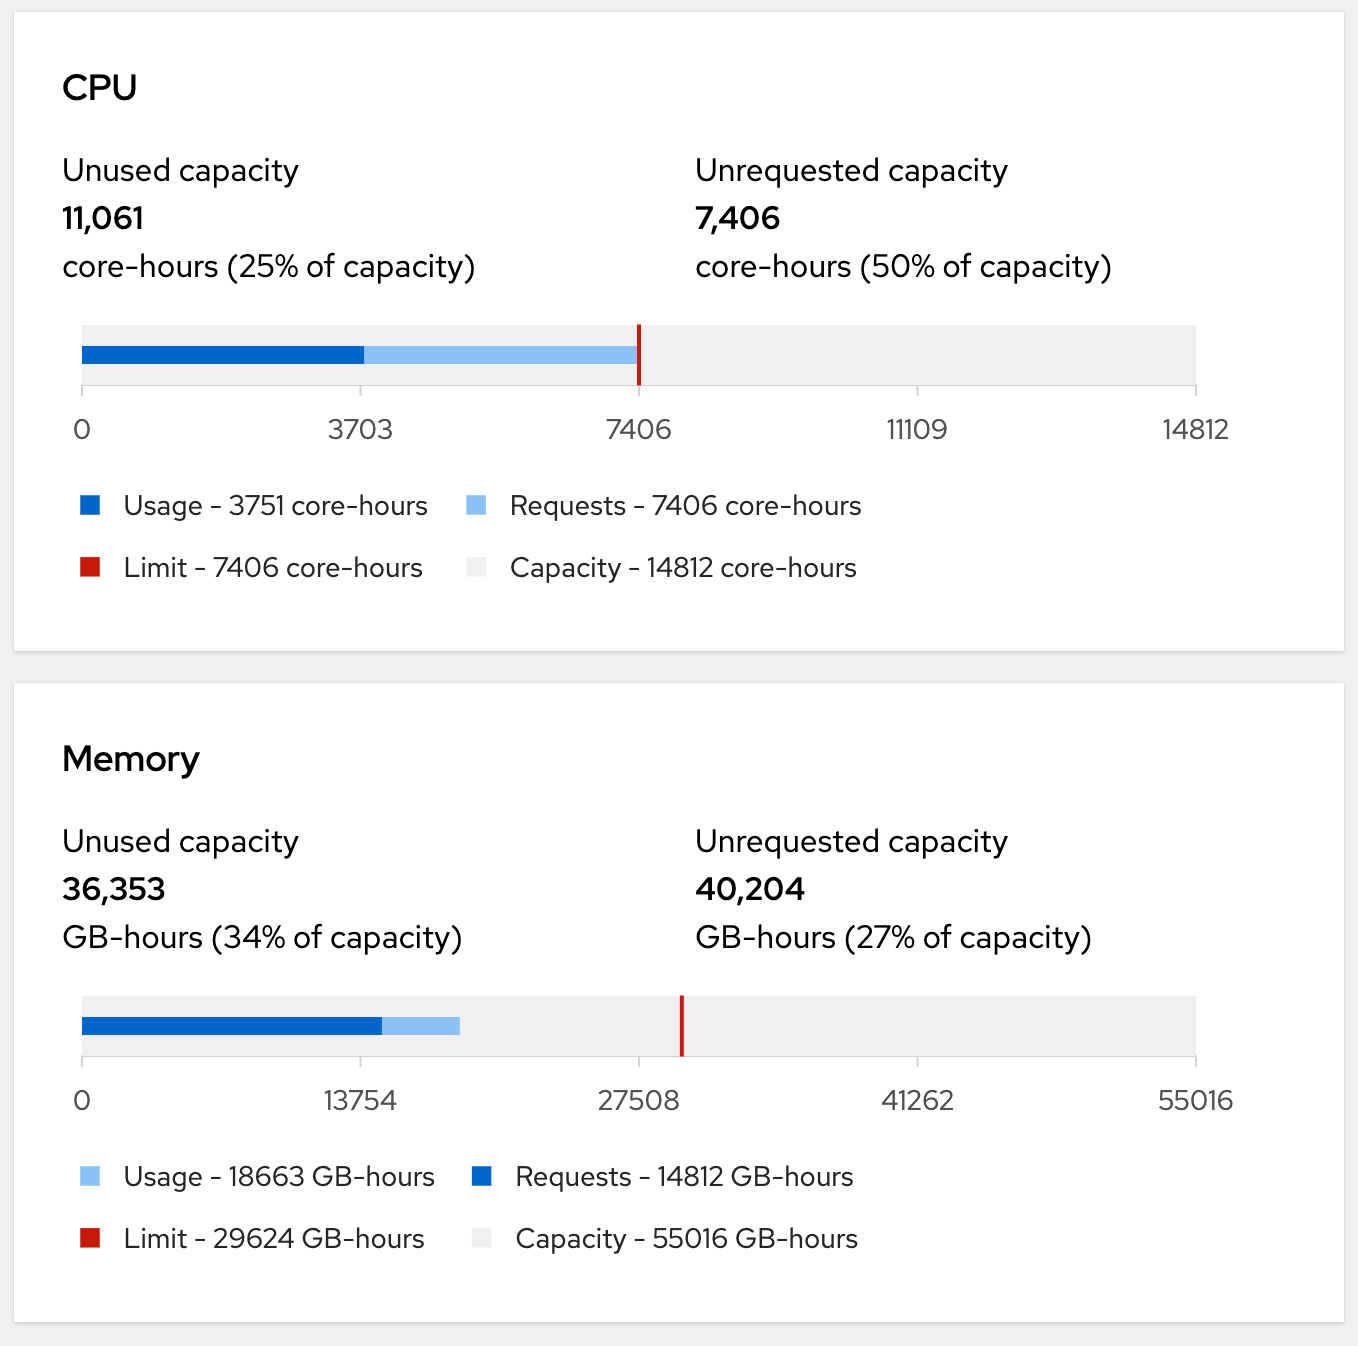
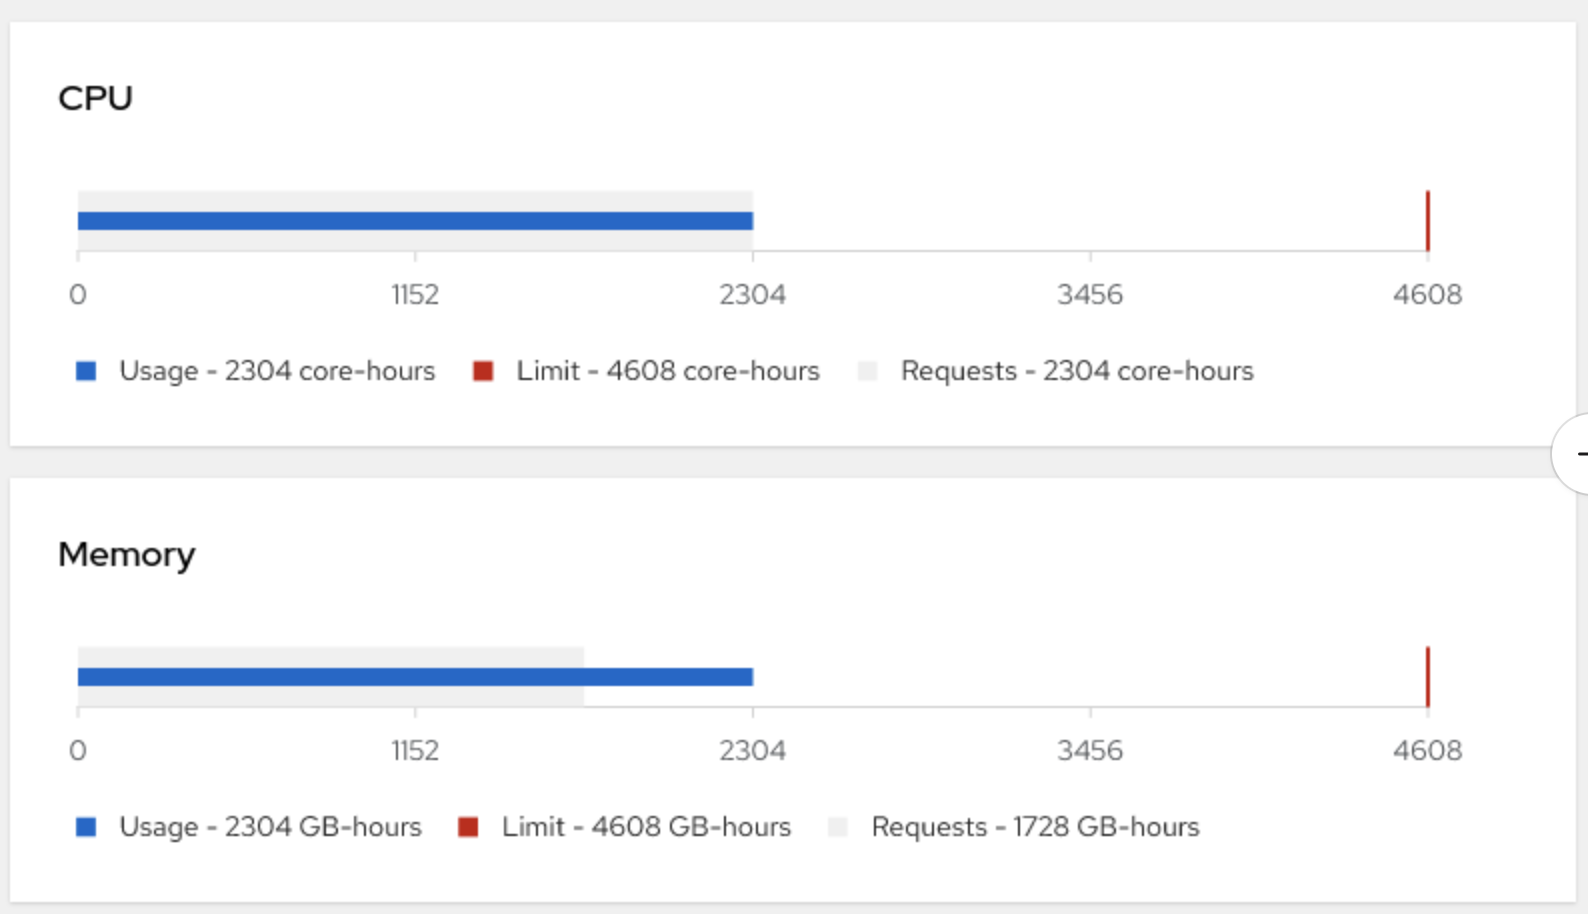
      When showing bullet charts without capacity, the requests are shown in grey instead of blue. For example, when OCP is grouped by project instead of cluster.

      In this case, requests are shown as the bullet chart's "qualitative range". To be consistent, requests and usage should be shown together as the "primary segmented measure".

      Example of "group by" project (no capacity)


      Example of "group by" cluster (with capacity)

            dlabrecq@redhat.com Daniel Labrecque
            dlabrecq@redhat.com Daniel Labrecque
            Votes:
            0 Vote for this issue
            Watchers:
            3 Start watching this issue

              Created:
              Updated:
              Resolved: