-
Bug
-
Resolution: Done
-
 Normal
-
None
-
None
-
False
-
False
-
Undefined
-
This was observed for OCP projects - but it may be general issue.
When we have different amount of projects for individual days and group_by[project] and filter[limit] are applied, api returns different "Others" for these specific days (e.g, "10 Others" vs. "5 Others" projects).
Currently Cost Explorer chart seems to treat these different Others as specific projects and consequently may show them among top 5 costliest projects.
Steps to reproduce:
env: ci-stable/ci-beta, user: cost-demo
- Cost Explorer
- Perspective: All OpenShift cost
- Group_by: Project
- select "Last 60 days" in date range dropdown menu
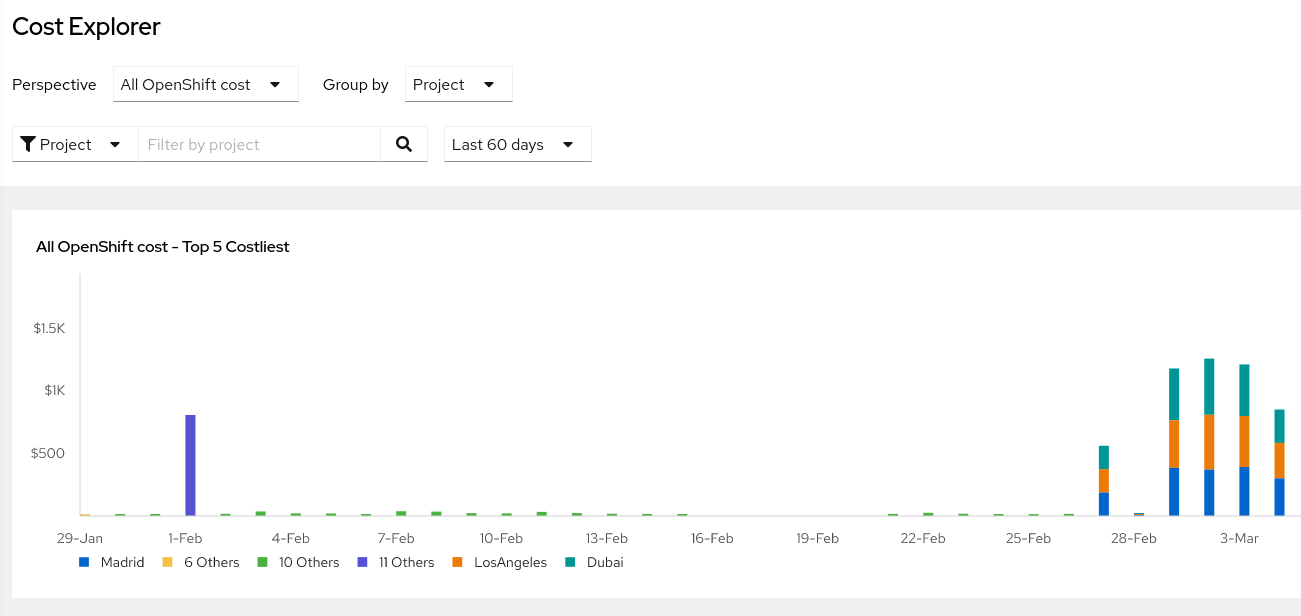
Chart shows data for "Madrid", "6 Others", "10 Others", "11 Others", "LosAngeles" and "Dubai" projects (ce_projects_60days.png)
Api returns following projects:
{'10 Others', '11 Others', '18 Others', '19 Others', '6 Others', 'Berlin', 'Dubai', 'HongKong', 'LosAngeles', 'Madrid'}So I believe the chart should show data for Berlin, Dubai, HongKong, LosAngeles and Madrid projects and data from all "Others" items should be presented together as "total_number Others".
- is related to
-
COST-864 Cost Explorer: 60 Days Historical View
-

- Closed
-