-
Bug
-
Resolution: Unresolved
-
 Major
Major
-
1.1.0
-
None
-
False
-
-
False
-
-
-
Moderate
-
None
Environment:
- ocp 4.18
- COO1.1 installed from fbc_image from March 15th: quay.io/redhat-user-workloads/cluster-observabilit-tenant/cluster-observability-operator/coo-fbc-v4-18@sha256:8a6557d7a1f52bd83d6589b2b7ee4d79ebbea6165b1ca7edd07438bfad8ce80c (instructions in how it was installed: https://docs.google.com/document/d/1-xN6y3VZbKrDOHpuTVlsT2MnGiDjYIl5qM6TNwQnLHo/edit?tab=t.l57owzgyn120)
- Monitoring UIPlugin installed:
- Go back to Operators > Installed Operators
- Select Cluster Observability Operator
- On the header, scroll horizontally and click on PersesDashboards
- Create in all namespaces using this template https://github.com/perses/perses-operator/blob/main/config/samples/perses.dev_v1alpha1_persesdashboard.yaml
- Rename “namespace=perses-dev” to openshift-cluster-observability-operator
- Save it
- On the header, scroll horizontally and click on PersesDatasources
- Create in all namespaces using this template https://github.com/perses/perses-operator/blob/main/config/samples/perses.dev_v1alpha1_persesdatasource.yaml
- Rename “namespace=perses-dev” to openshift-cluster-observability-operator
- Save it
- On the header, scroll horizontally and click on UIPlugin
- Click on Create UIPlugin button
- Fill / Select:
- Expand incidents
- Enabled = true
- Expand perses section
- Enabled = true
- Name: monitoring
- Type: Monitoring
- Expand monitoring section
- Expand incidents
- Click on Create button
- Go to Workloads > Pods
- Verify monitoring pod
- Verify perses pod
- Both pods should be created without any errors
- Wait for some seconds / minute and verify a warning message on the right top corner
- Web console update is available. There has been an update to the web console. Ensure any changes have been saved and refresh your browser to access the latest version. Refresh web console link
- Click on Refresh web console link
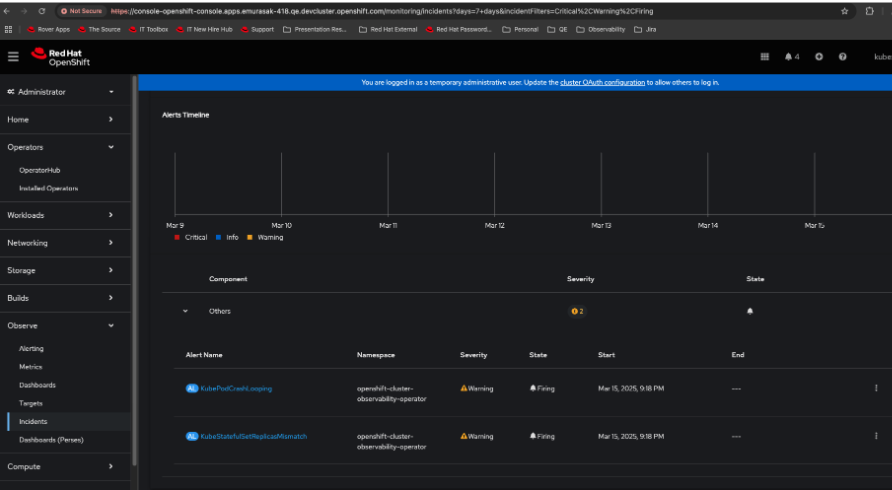
- Go To Observe >
- Verify Incidents submenu
- Hover the alert shown in the graph
- Alerts timeline graph should be displayed
- Alerts table should be displayed on the bottom

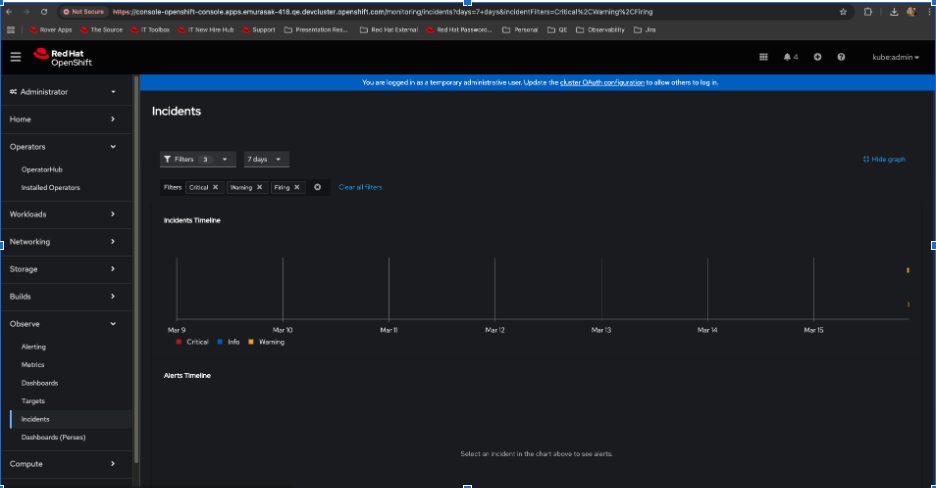
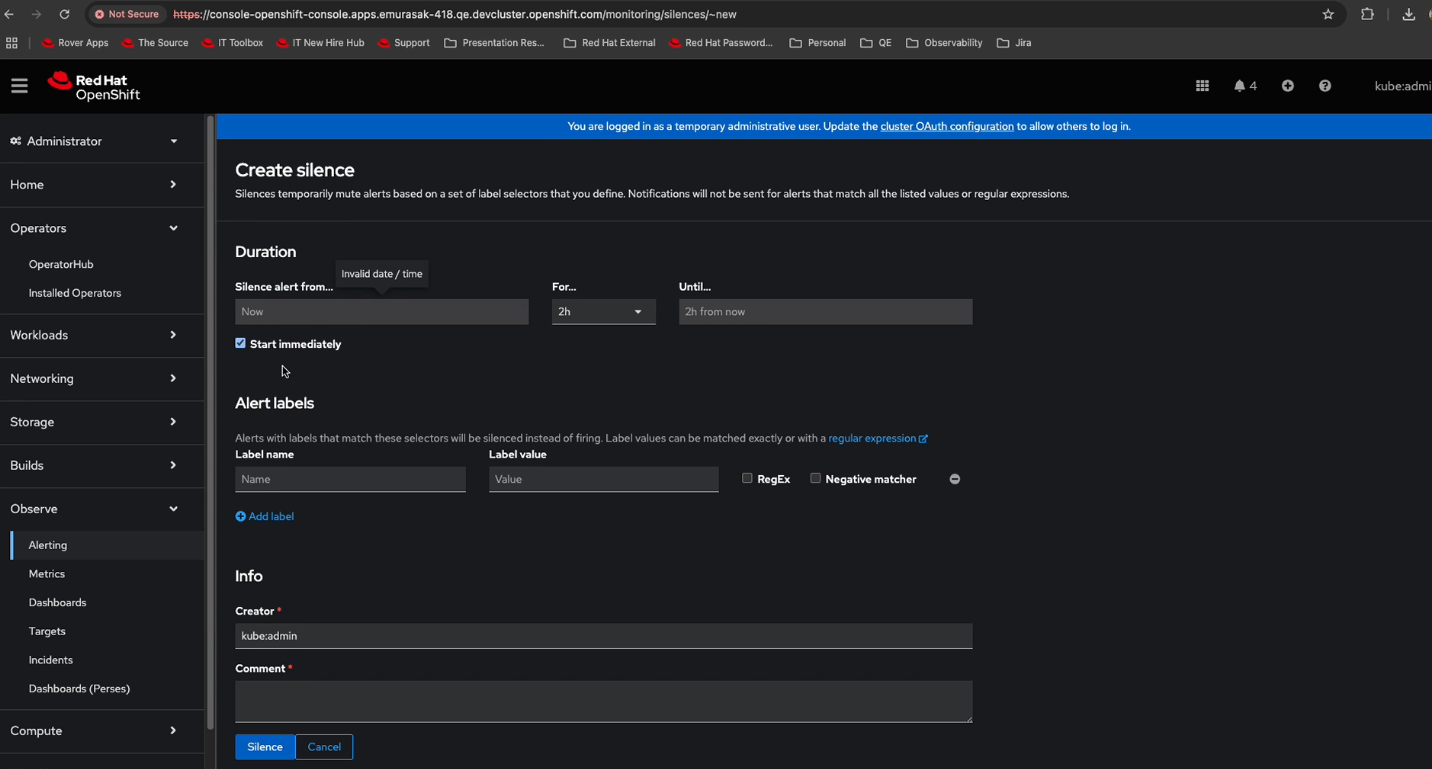
Actual Behavior: watch the attached video. When you want to Silent an alert from Incidents page by clicking on Kebab icon (3dots), Create silence page is loaded without labels. If you compare and try to Go To Observe > Incidents, click on Alert name link and then Silent it, you will see tons of labels being loaded.
From Incidents > kebab link > Silent alert => look at the URL you won't see any parameter
From Incidents > Alert name link > Alert details page and then Silent alert => look at the URL you will see many parameters
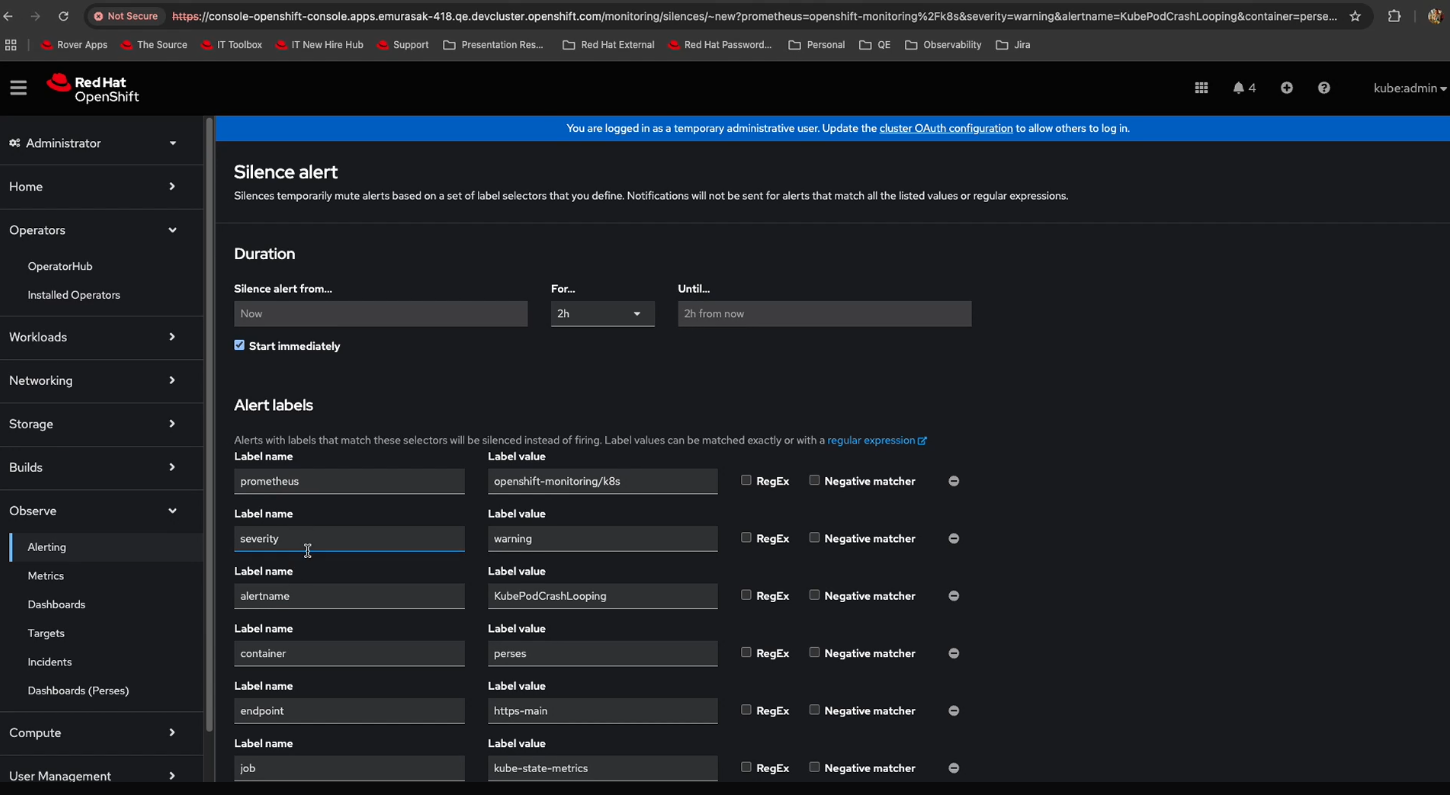
Expected Behavior: Go To Observe > Incidents > Alert table, click on kebab icon > Silent alert should load all labels and the page the same as you would click on Alert name link and then Silent it from there.