-
Bug
-
Resolution: Done
-
 Critical
-
1.1.0
-
Quality / Stability / Reliability
-
False
-
-
None
-
None
-
None
-
None
-
None
-
None
-
None
-
None
Install coo 1.1 with FBC image
lastPromotedImage: quay.io/redhat-user-workloads/cluster-observabilit-tenant/cluster-observability-operator/coo-fbc-v4-18@sha256:1cefdaed5b65794649a7f908e5067c4924a1be3b7b206f802fc679824990c408
FAIL: TestMonitoringStackController/Prometheus_stacks_can_scrape_themselves_and_web_UI_works (43.30s)
Regression issue of COO-34 Web UI is broken in COO 0.1.1
Execute TestMonitoringStackController/Prometheus_stacks_can_scrape_themselves_and_web_UI_works to create monitoringstack
Manual check
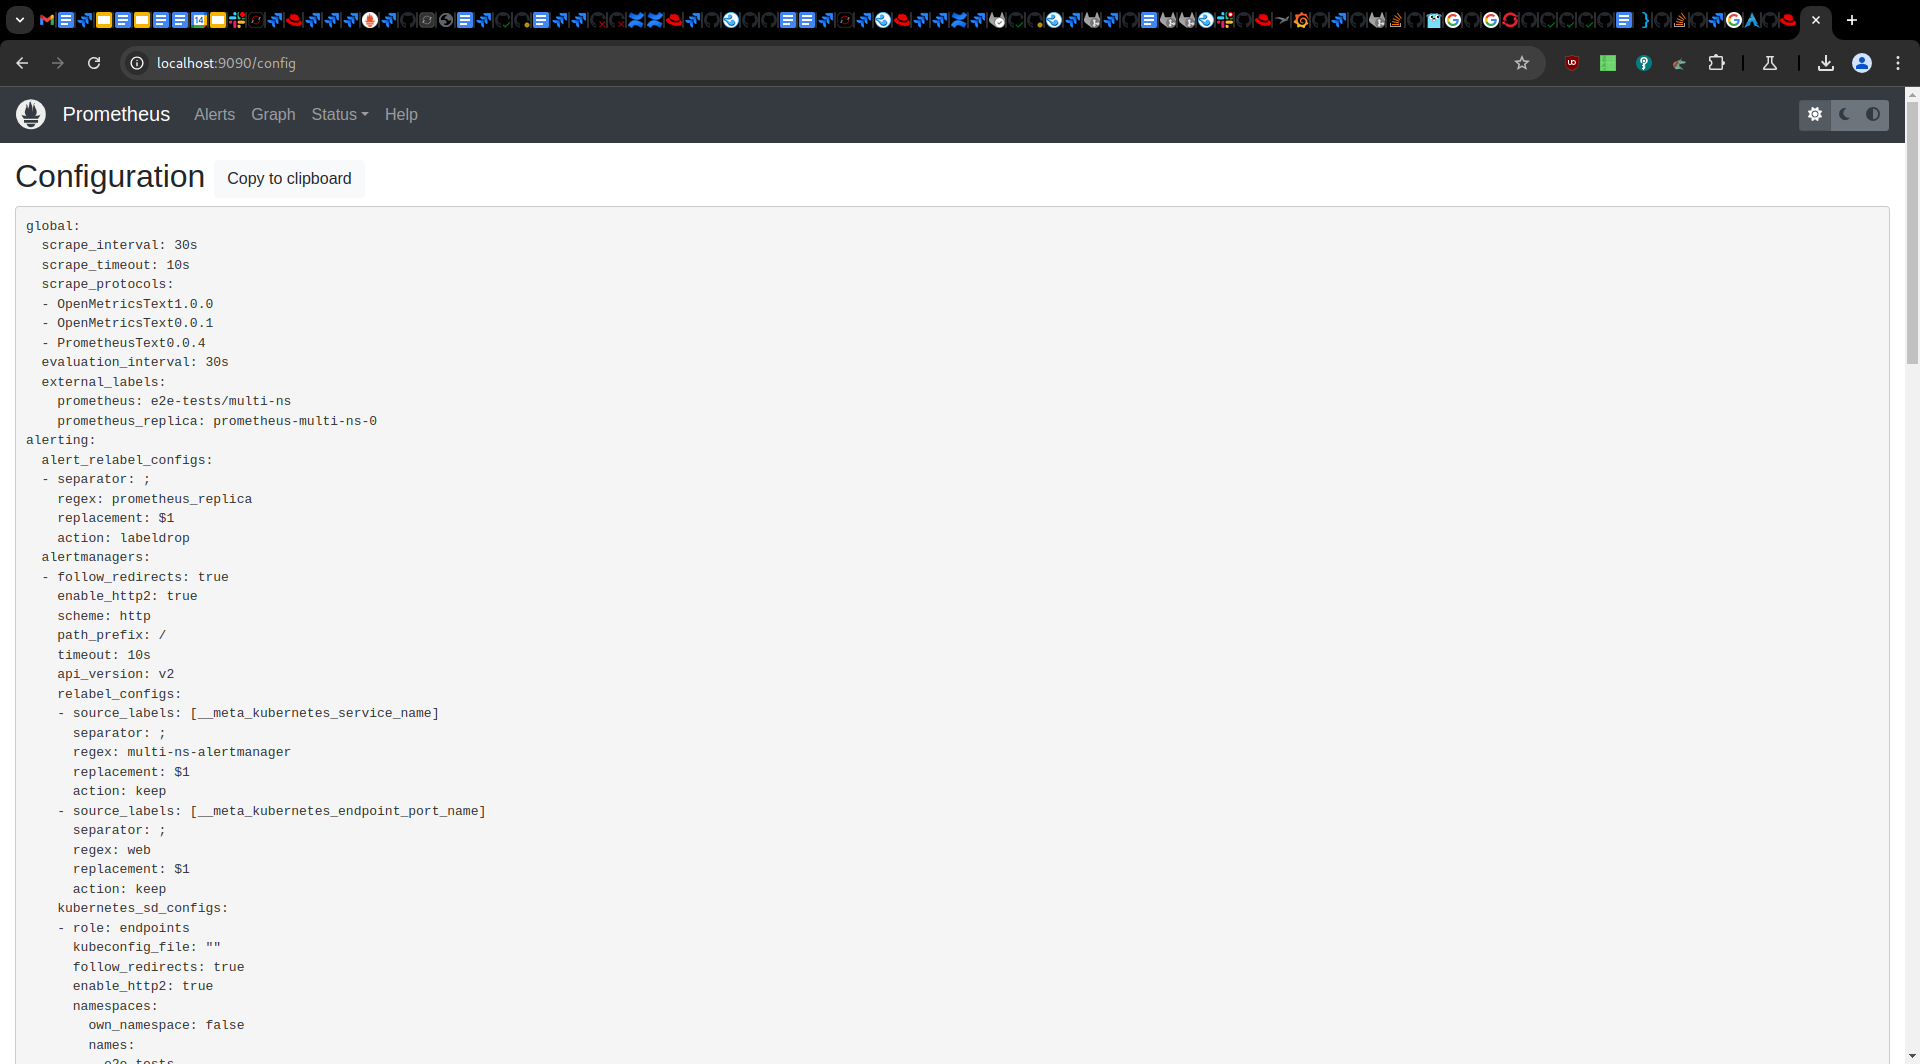
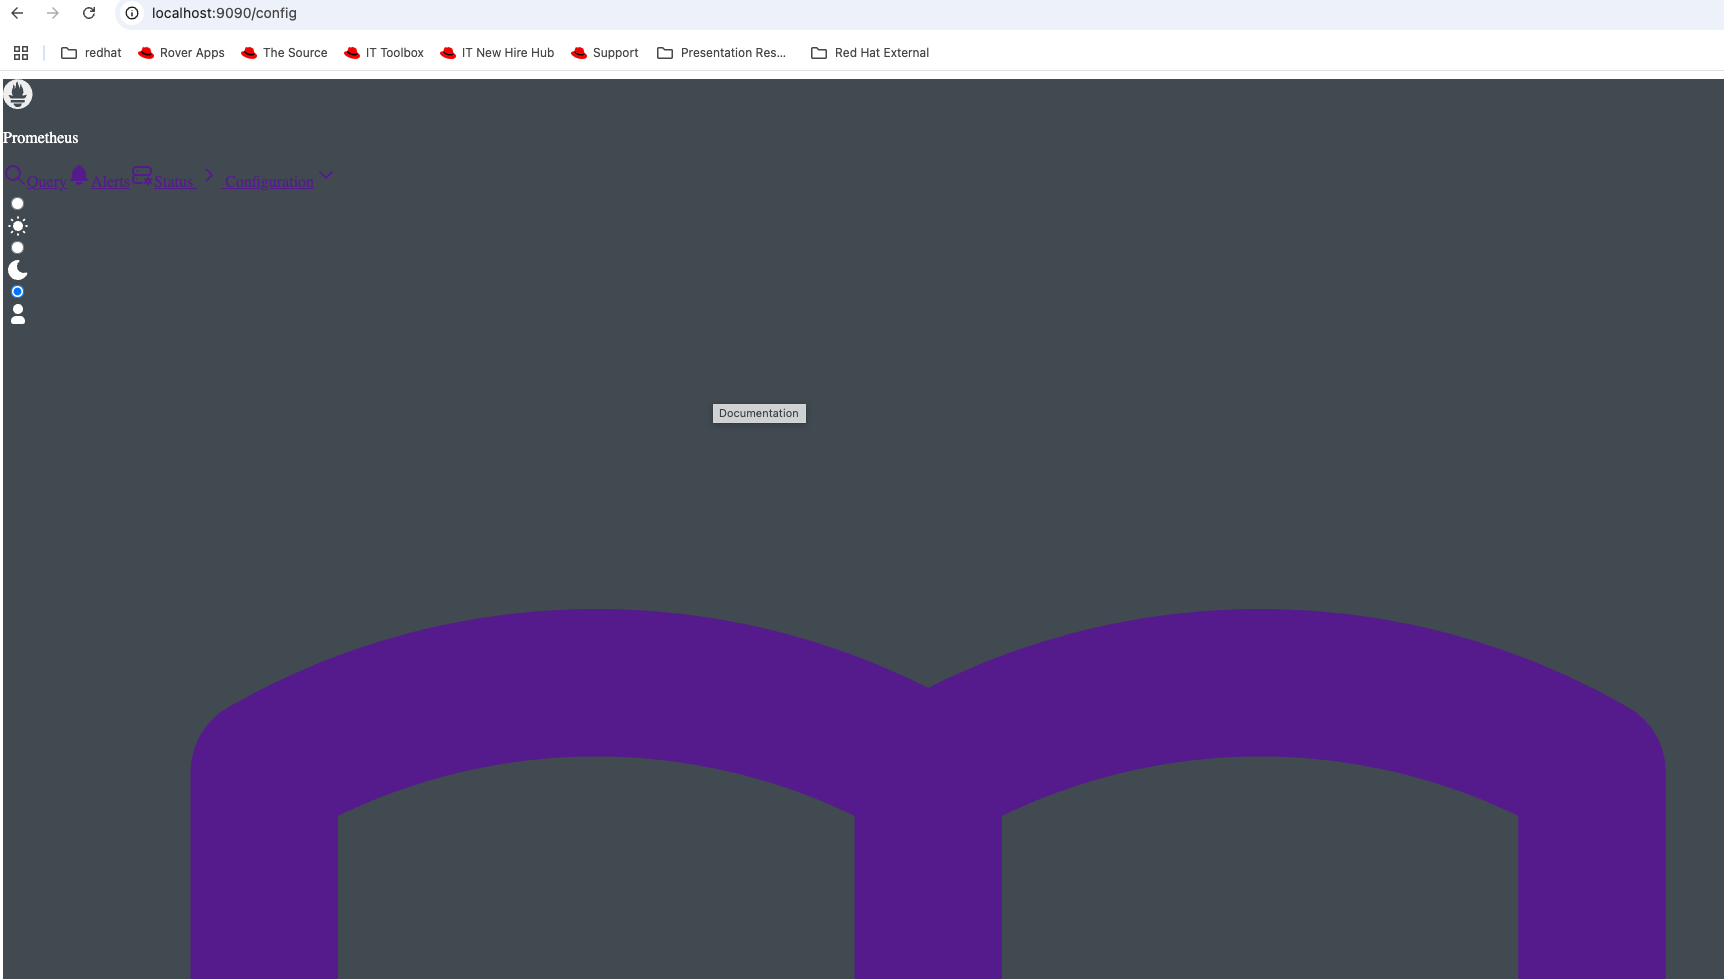
Access http://localhost:9090/graph , get
Error opening React index.html: open web/ui/static/mantine-ui/index.html: no such file or directory
oc -n e2e-tests port-forward svc/tq-ms-combo-tls-prometheus 9090:9090

curl 'http://localhost:9090/graph'
<a href="/query?">Found</a>.
% curl 'http://localhost:9090/api/v1/query?' --data-urlencode 'query=alertmanager_build_info' | jq
  % Total    % Received % Xferd  Average Speed   Time    Time     Time  Current
                                 Dload  Upload   Total   Spent    Left  Speed
100   889  100   860  100    29   1167     39 --:--:-- --:--:-- --:--:--  1206
{
  "status": "success",
  "data": {
    "resultType": "vector",
    "result": [
      {
        "metric": {
          "__name__": "alertmanager_build_info",
          "container": "alertmanager",
          "endpoint": "web",
          "goarch": "amd64",
          "goos": "linux",
          "goversion": "go1.22.9 (Red Hat 1.22.9-2.el9_5)",
          "instance": "10.131.0.61:9093",
          "job": "alertmanager-self",
          "namespace": "e2e-tests",
          "pod": "alertmanager-tq-ms-combo-tls-0",
          "revision": "unknown",
          "service": "tq-ms-combo-tls-alertmanager",
          "tags": "netgo"
        },
        "value": [
          1741852920.222,
          "1"
        ]
      },
      {
        "metric": {
          "__name__": "alertmanager_build_info",
          "container": "alertmanager",
          "endpoint": "web",
          "goarch": "amd64",
          "goos": "linux",
          "goversion": "go1.22.9 (Red Hat 1.22.9-2.el9_5)",
          "instance": "10.129.2.80:9093",
          "job": "alertmanager-self",
          "namespace": "e2e-tests",
          "pod": "alertmanager-tq-ms-combo-tls-1",
          "revision": "unknown",
          "service": "tq-ms-combo-tls-alertmanager",
          "tags": "netgo"
        },
        "value": [
          1741852920.222,
          "1"
        ]
      }
    ]
  }
}