-
Bug
-
Resolution: Done
-
 Major
Major
-
0.3.0
-
None
-
None
-
Quality / Stability / Reliability
-
False
-
-
None
-
Moderate
-
No
-
None
-
None
-
None
-
None
-
None
Version of components:
observability-operator.v0.3.0-dev-0.1.1
quay.io/rhn_support_ikanse/observability-operator-bundle:0.3.0-dev-0.1.1
OCP version 4.15.19
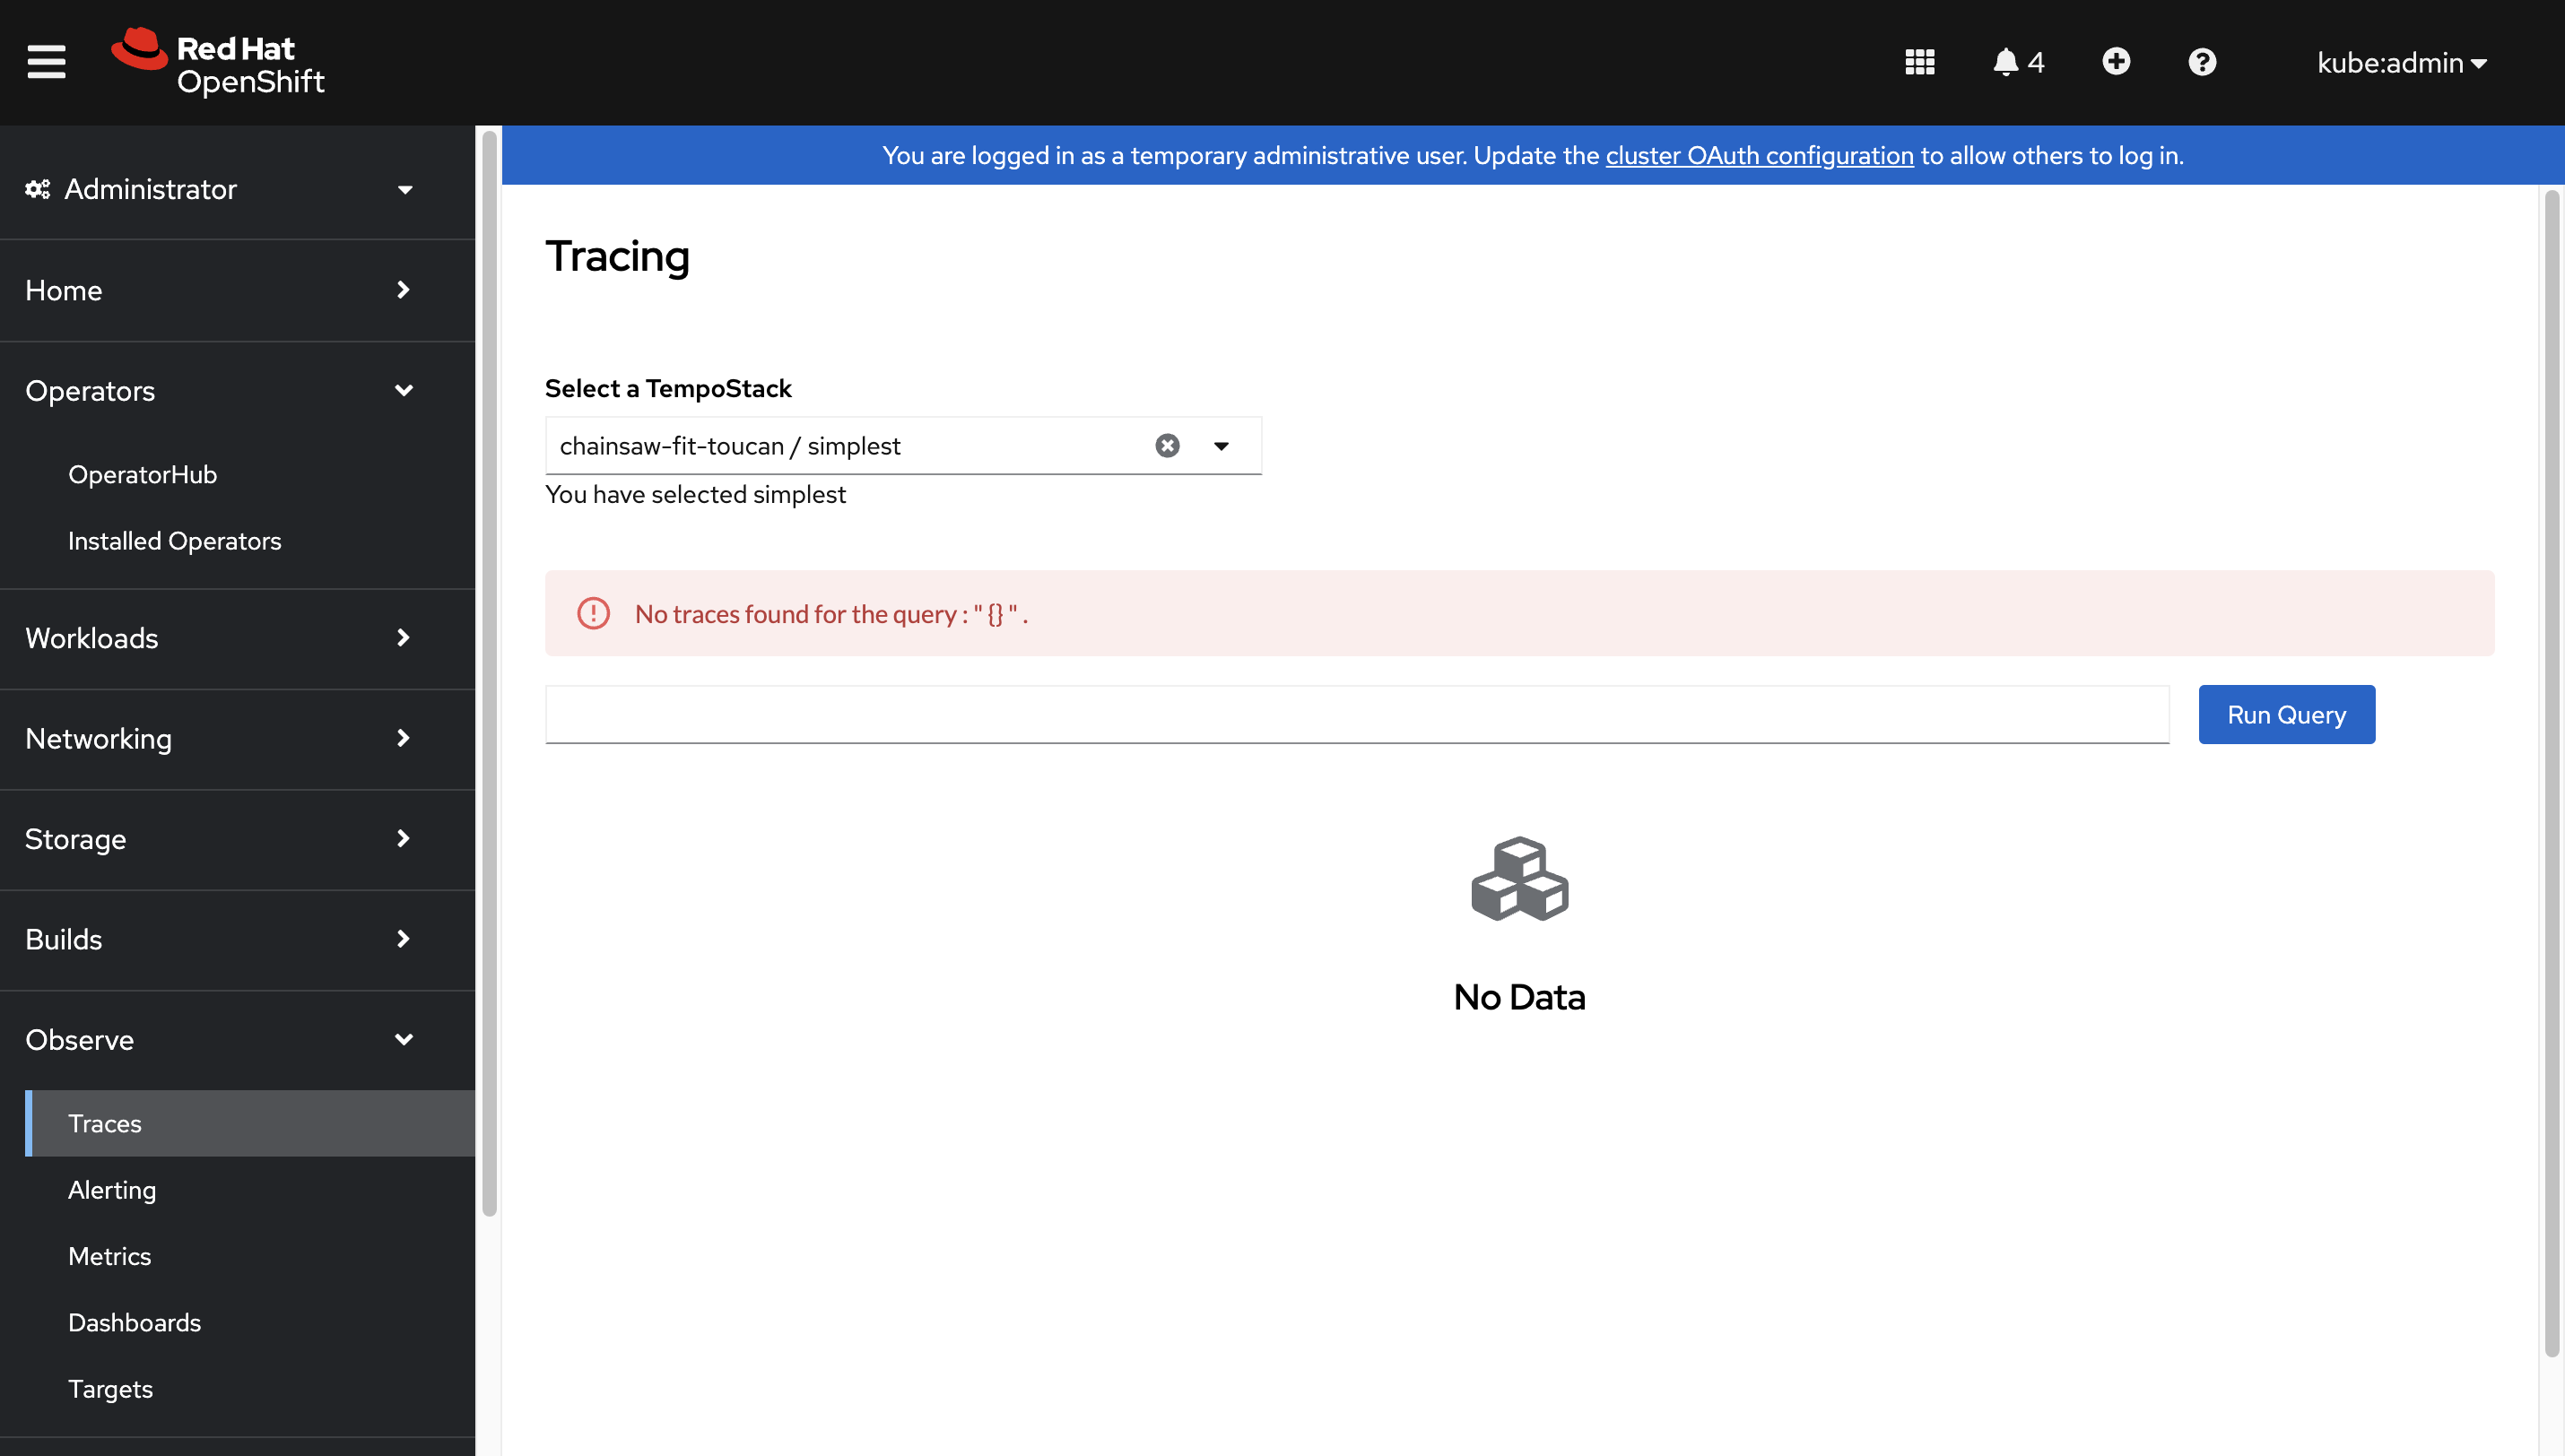
Description of the problem:
In the distributed-tracing-console-plugin Tracing view, Traces older than 15 minutes are not shown and there is no UI option to select the time period for Traces.
Steps to reproduce the issue:
*Install the Observability Operator built off the upstream main branch.
*Create the distributed-tracing-console-plugin resource from the Observability Operator UIPlugin.
*Deploy a TempoStack, generate and send Traces to the TempoStack.
*Wait for more than 15 minutes.
*Check the Traces in TempoStack from OCP web console > Observe > Traces > Select the TempoStack instance.
*No Traces are displayed and there is no UI option to select the time period for Traces.

- links to
-
 RHEA-2024:131884
Cluster Observability Operator 0.3 for OpenShift
RHEA-2024:131884
Cluster Observability Operator 0.3 for OpenShift

