-
Bug
-
Resolution: Done
-
 Major
Major
-
0.3.0
-
None
-
None
-
Quality / Stability / Reliability
-
False
-
-
None
-
Important
-
No
-
None
-
Sprint 255
-
None
-
None
-
None
Version of components:
observability-operator.v0.3.0-dev-0.1.1
quay.io/rhn_support_ikanse/observability-operator-bundle:0.3.0-dev-0.1.1
OCP version 4.15.19
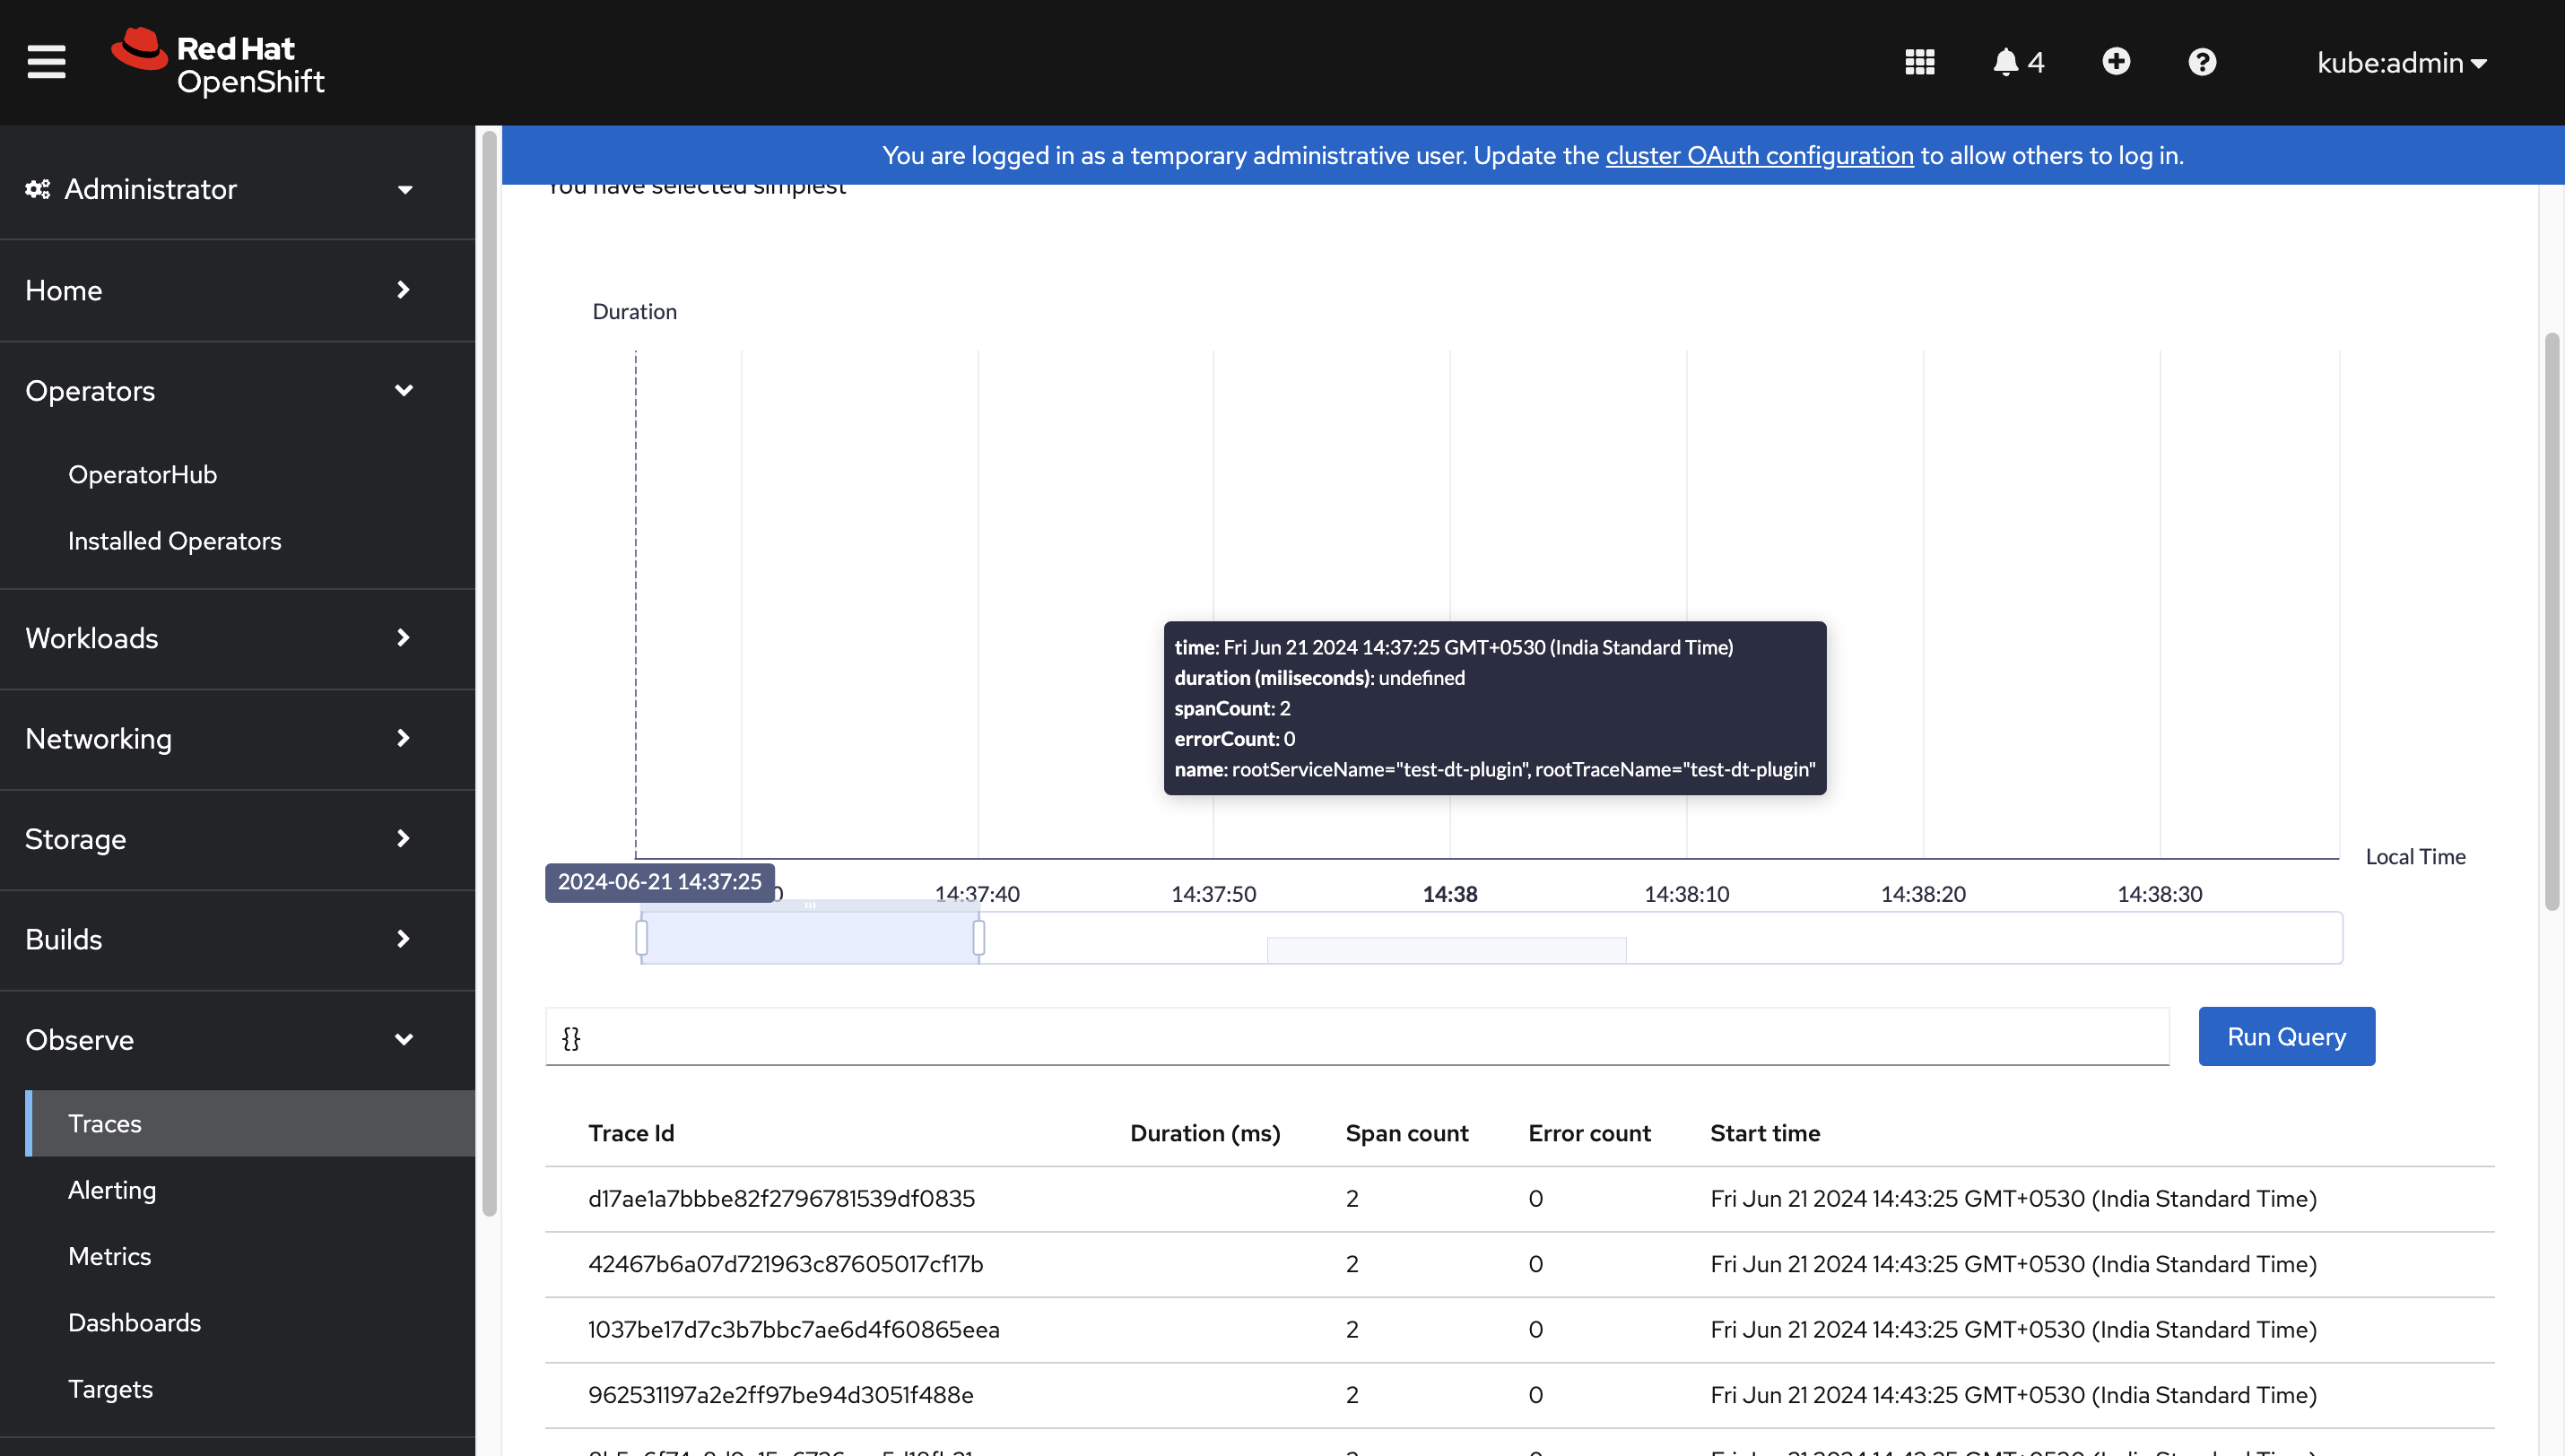
Description of the issue:
Duration for Traces are not displayed in the distributed-tracing-console-plugin UI when the duration for Traces is in microseconds. If Traces are generated with milliseconds, the duration is displayed.

Expected behaviour:
Duration for mircroseconds can be shows as float in the UI.
Steps to reproduce the issue:
*Install Observability Operator built off the upstream main branch.
*Create the distributed-tracing-console-plugin resource from Observability Operator UIPlugin.
*Create a TempoStack, generate and send Traces to the stack using the following Telemetrygen job. Make sure to update the TempoStack distributor name in the job.
apiVersion: batch/v1
kind: Job
metadata:
  name: generate-traces
spec:
  template:
    spec:
      containers:
      - name: telemetrygen
        image: ghcr.io/open-telemetry/opentelemetry-collector-contrib/telemetrygen:v0.92.0
        args:
        - traces
        - --otlp-endpoint=tempo-simplest-distributor:4317
        - --otlp-insecure
        - --traces=100
        - --span-duration=180µs
        - --service=test-dt-plugin
      restartPolicy: Never
  backoffLimit: 4
*Check the Traces from the TempoStack in the OCP web console.
*The Traces are missing the duration field.
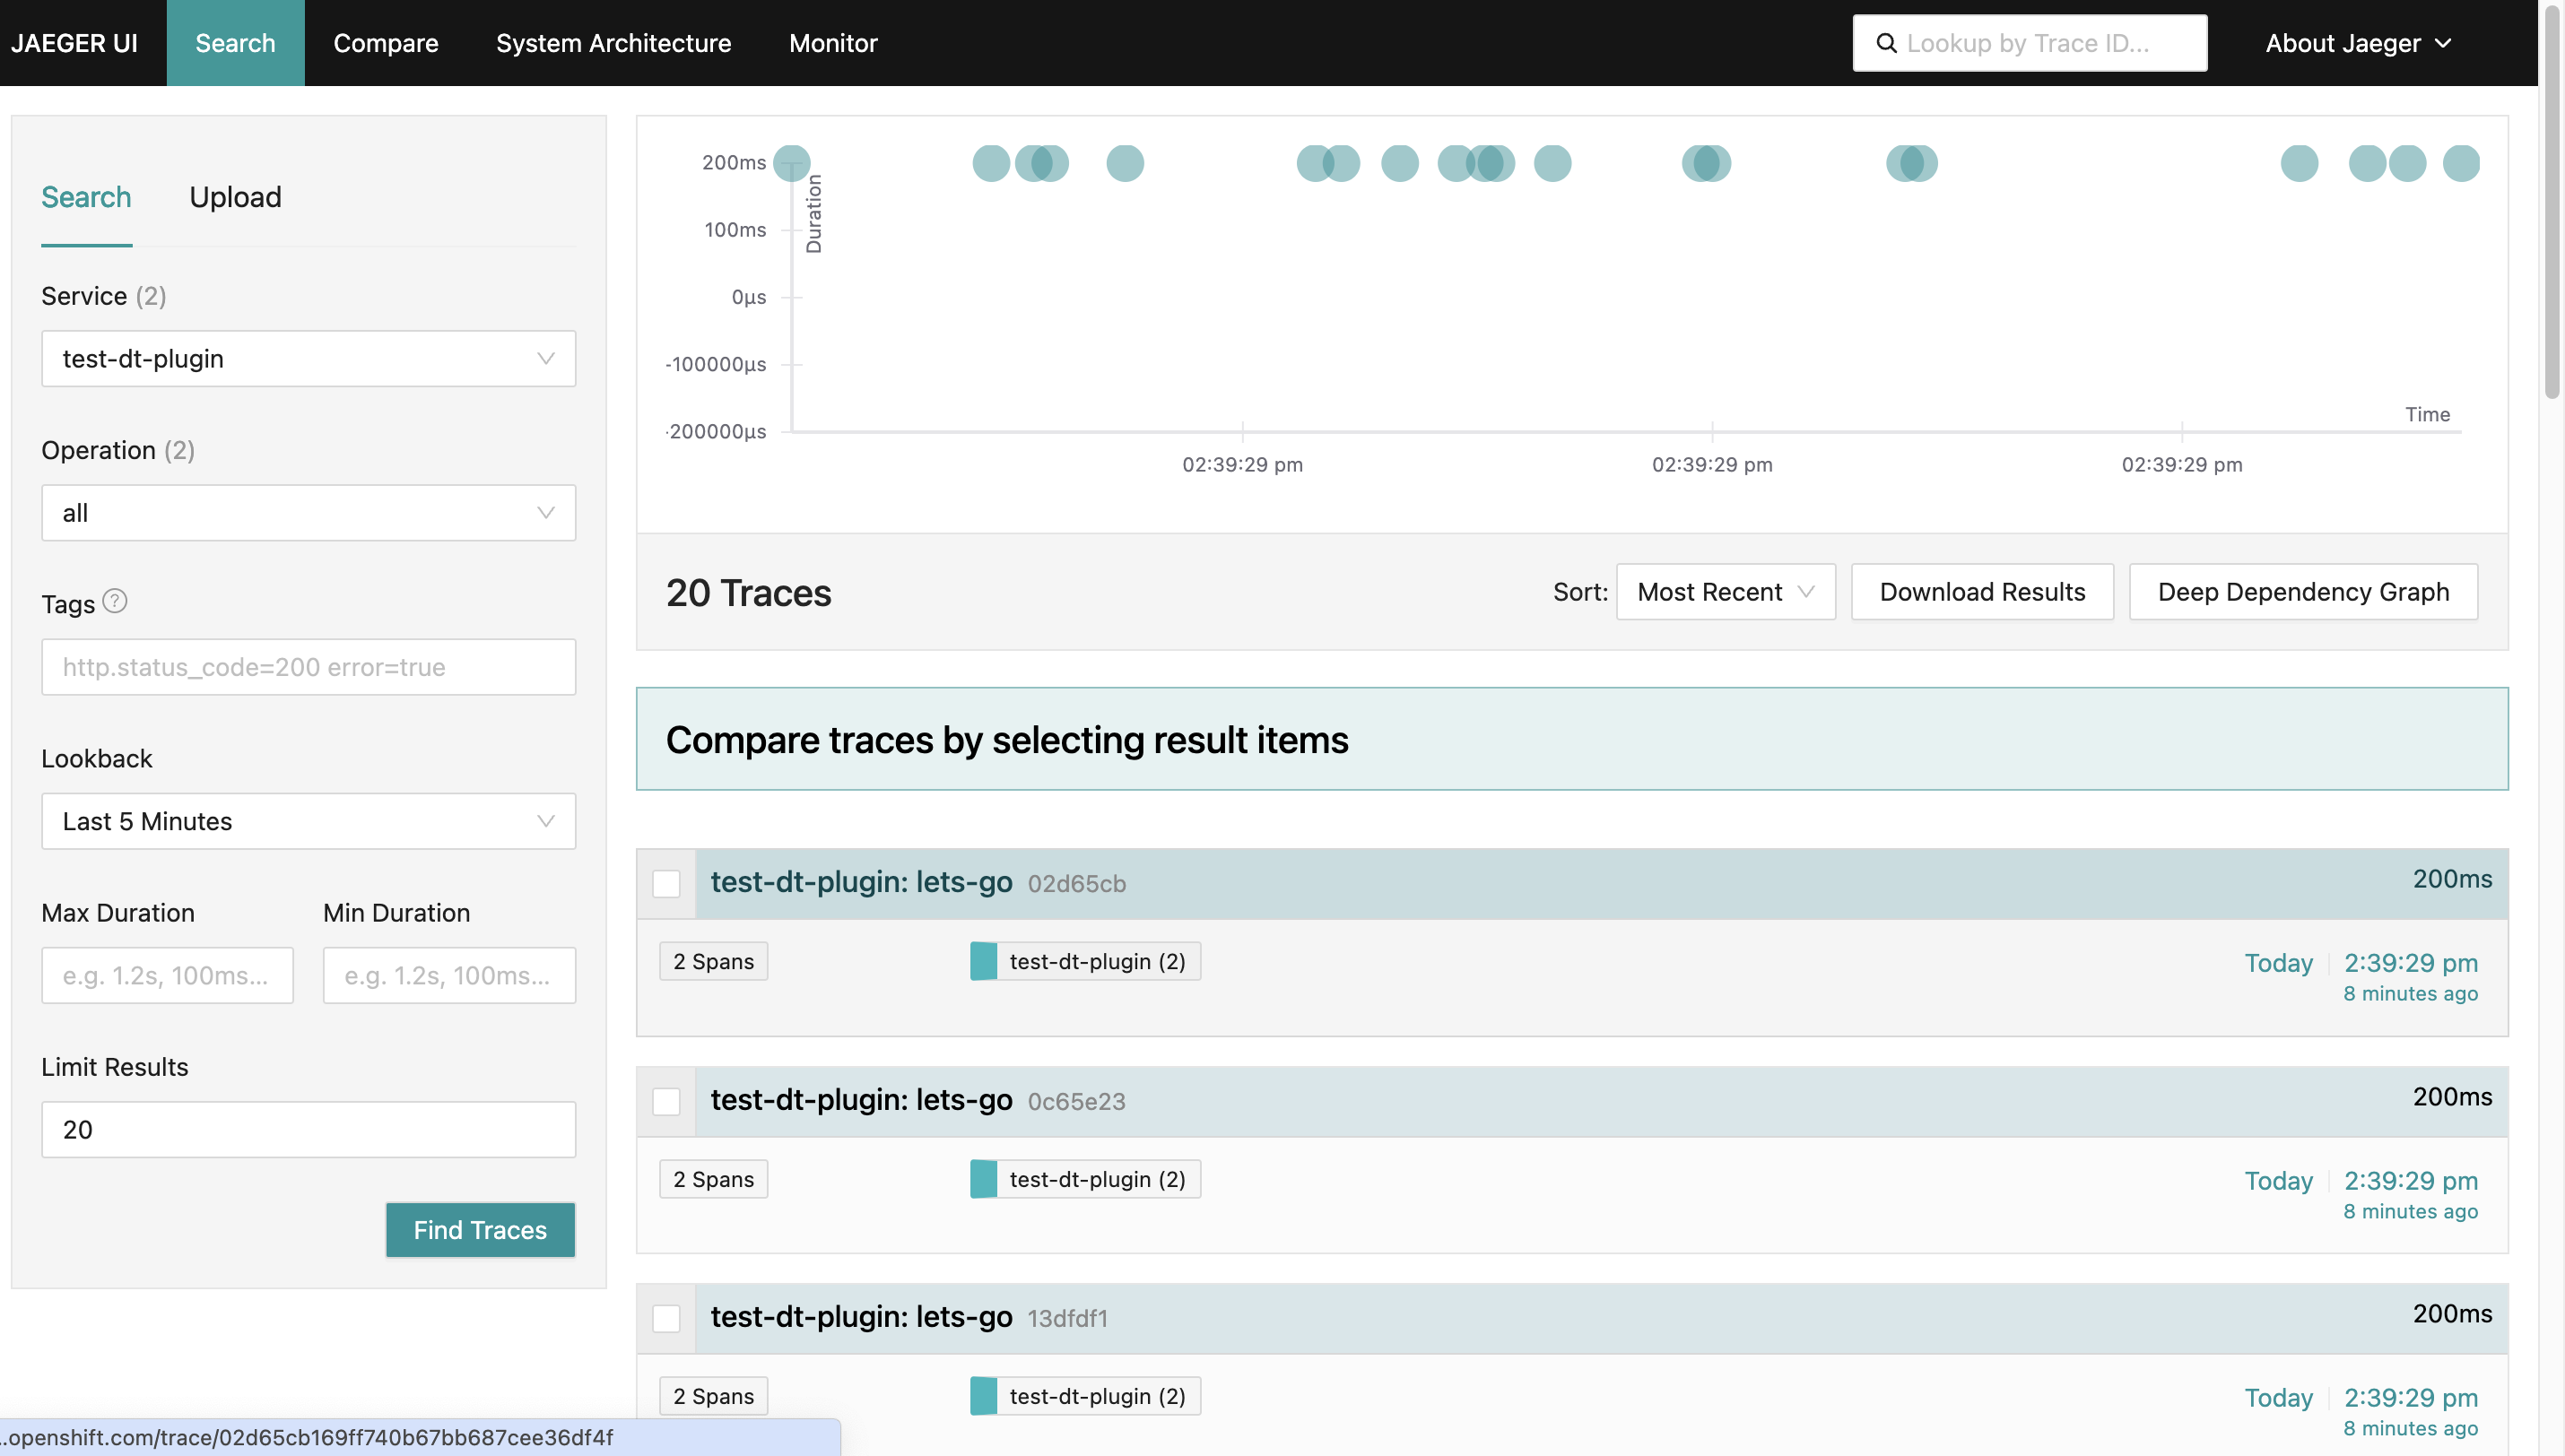
*Check the Traces from the TempoQuery frontend, Traces with duration are displayed.

{
    "data": [
        {
            "traceID": "02d65cb169ff740b67bb687cee36df4f",
            "spans": [
                {
                    "traceID": "02d65cb169ff740b67bb687cee36df4f",
                    "spanID": "06d662b5fcc6c6d5",
                    "operationName": "lets-go",
                    "references": [],
                    "startTime": 1718960969315719,
                    "duration": 200000,
                    "tags": [
                        {
                            "key": "net.peer.ip",
                            "type": "string",
                            "value": "1.2.3.4"
                        },
                        {
                            "key": "peer.service",
                            "type": "string",
                            "value": "telemetrygen-server"
                        },
                        {
                            "key": "span.kind",
                            "type": "string",
                            "value": "client"
                        }
                    ],
                    "logs": [],
                    "processID": "p1",
                    "warnings": null
                },
                {
                    "traceID": "02d65cb169ff740b67bb687cee36df4f",
                    "spanID": "d1310e9c11207971",
                    "operationName": "okey-dokey",
                    "references": [
                        {
                            "refType": "CHILD_OF",
                            "traceID": "02d65cb169ff740b67bb687cee36df4f",
                            "spanID": "06d662b5fcc6c6d5"
                        }
                    ],
                    "startTime": 1718960969315719,
                    "duration": 200000,
                    "tags": [
                        {
                            "key": "net.peer.ip",
                            "type": "string",
                            "value": "1.2.3.4"
                        },
                        {
                            "key": "peer.service",
                            "type": "string",
                            "value": "telemetrygen-client"
                        },
                        {
                            "key": "span.kind",
                            "type": "string",
                            "value": "server"
                        }
                    ],
                    "logs": [],
                    "processID": "p1",
                    "warnings": null
                }
            ],
            "processes": {
                "p1": {
                    "serviceName": "test-dt-plugin",
                    "tags": [
                        {
                            "key": "otel.library.name",
                            "type": "string",
                            "value": "telemetrygen"
                        }
                    ]
                }
            },
            "warnings": null
        }
    ],
    "total": 0,
    "limit": 0,
    "offset": 0,
    "errors": null
}
- links to
-
 RHEA-2024:131884
Cluster Observability Operator 0.3 for OpenShift
RHEA-2024:131884
Cluster Observability Operator 0.3 for OpenShift

