-
Bug
-
Resolution: Done
-
 Undefined
-
None
-
0.2.0
-
None
-
None
-
Quality / Stability / Reliability
-
False
-
-
None
-
Critical
-
No
-
None
-
None
-
None
-
None
-
None
Test on OCP 4.15.11 with aos-4_15/ipi-on-azure/versioned-installer
Install COO 0.2.0 with latest stage image and create dashboard UIplugin
#!/bin/bash
set -eux
#From ObO user doc
oc apply -f - <<EOF
apiVersion: observability.openshift.io/v1alpha1
kind: UIPlugin
metadata:
  name: ui-dashboards
spec:
  type: Dashboards
EOF
Create the following datasource, it has been working last week and begin failing today,
oc apply -f - <<EOF
apiVersion: v1
kind: ConfigMap
metadata:
  name: cluster-prometheus-proxy
  namespace: openshift-config-managed
  labels:
    console.openshift.io/dashboard-datasource: 'true'
data:
  'dashboard-datasource.yaml': |-
    kind: "Datasource"
    metadata:
      name: "cluster-prometheus-proxy"
      project: "openshift-config-managed"
    spec:
      plugin:
        kind: "Prometheus"
        spec:
          direct_url = "https://thanos-querier.openshift-monitoring.svc.cluster.local.9091"
EOF
Access URL "https://console-openshift-console.apps.hongyli-0428.qe.azure.devcluster.openshift.com/api/proxy/plugin/console-dashboards-plugin/backend/api/v1/datasources/cluster-prometheus-proxy" get "datasource not found"
Check UI pod logs
10.129.0.84 - - [28/Apr/2024:06:12:23 +0000] "GET /api/v1/datasources/cluster-prometheus-proxy HTTP/1.1" 404 21
time="2024-04-28T06:12:23Z" level=error msg="datasource not found: cluster-prometheus-proxy" module=datasources-api
10.129.0.84 - - [28/Apr/2024:06:12:23 +0000] "GET /api/v1/datasources/cluster-prometheus-proxy HTTP/1.1" 404 21
time="2024-04-28T06:12:24Z" level=error msg="datasource not found: cluster-prometheus-proxy" module=datasources-api
10.129.0.84 - - [28/Apr/2024:06:12:24 +0000] "GET /api/v1/datasources/cluster-prometheus-proxy HTTP/1.1" 404 21
Go back to document and create datasource cm as the following, change kind to 'PrometheusDatasource'
% oc apply -f - <<EOF
apiVersion: v1
kind: ConfigMap
metadata:
  name: prometheus-datasource-test
  namespace: openshift-config-managed
  labels:
    console.openshift.io/dashboard-datasource: 'true'
data:
  'dashboard-datasource.yaml': |-
    kind: "Datasource"
    metadata:
      name: "prometheus-datasource-test"
      project: "openshift-config-managed"
    spec:
      plugin:
        kind: "PrometheusDatasource"
        spec:
          direct_url: "https://thanos-querier.openshift-monitoring.svc.cluster.local.9091"
EOF
Access URL "https://console-openshift-console.apps.hongyli-0428.qe.azure.devcluster.openshift.com/api/proxy/plugin/console-dashboards-plugin/backend/api/v1/datasources/prometheus-datasource-test" and get correct datasource
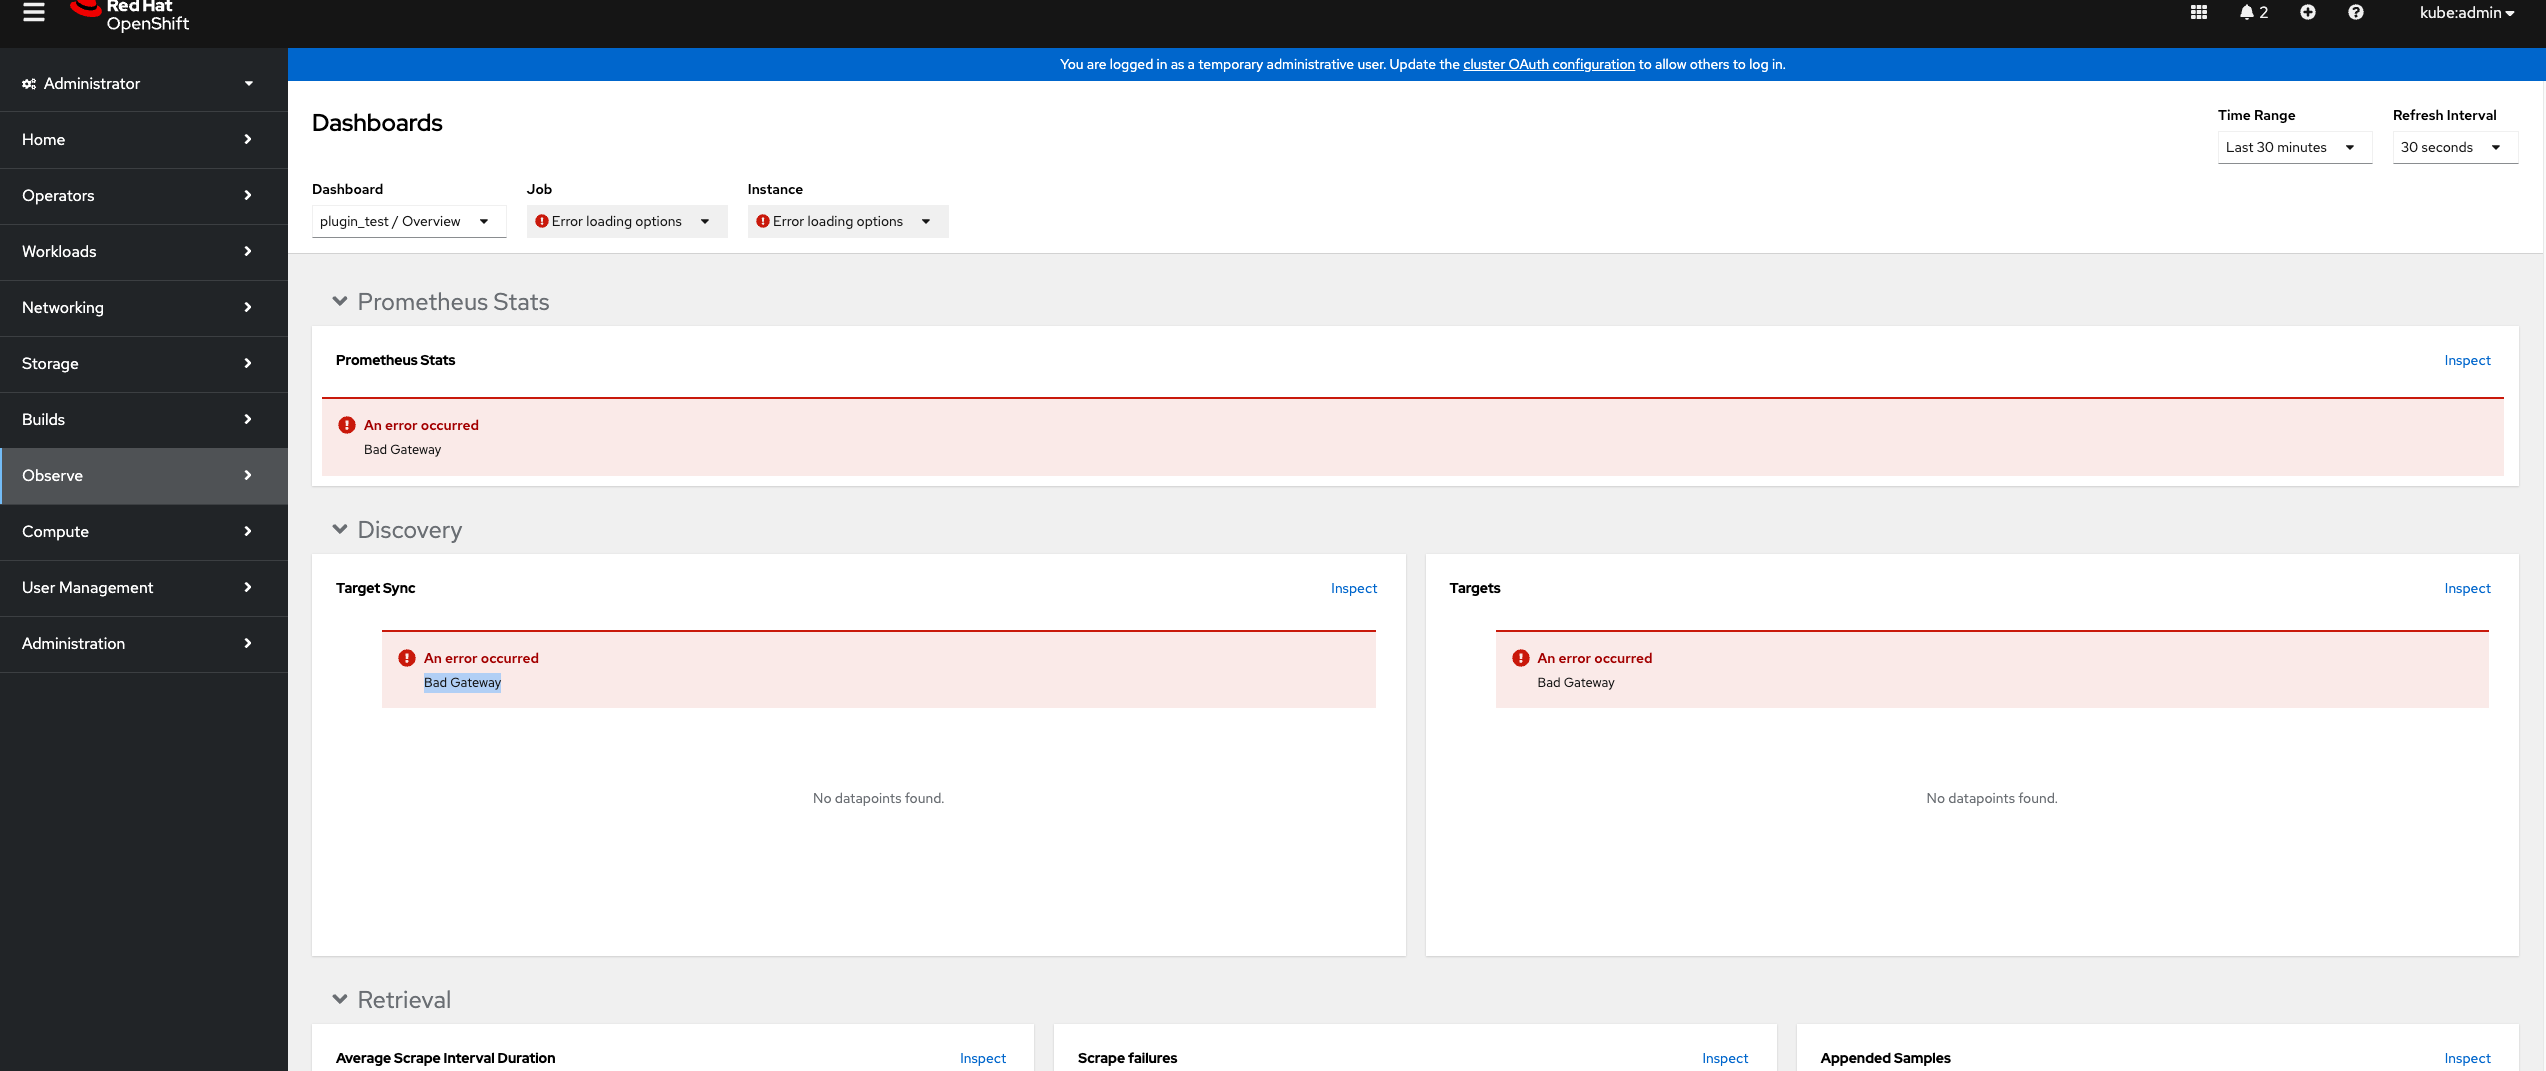
Create dashboard configmap and check the dashboard from UI, find dashboard display 'Bad Gateway error, detail see screenshot.
logs of UIplugin pod
10.129.0.84 - - [28/Apr/2024:07:02:40 +0000] "GET /proxy/prometheus-datasource-test/api/v1/query_range?start=1714285959.383&end=1714287759.383&step=30&query=sum+by+%28job%29+%28rate%28prometheus_target_scrapes_sample_out_of_bounds_total%5B1m%5D%29%29&timeout=60s HTTP/1.1" 502 0
2024/04/28 07:02:41 http: proxy error: dial tcp: lookup thanos-querier.openshift-monitoring.svc.cluster.local.9091 on 172.30.0.10:53: no such host
10.129.0.84 - - [28/Apr/2024:07:02:41 +0000] "GET /proxy/prometheus-datasource-test/api/v1/query_range?start=1714285959.383&end=1714287759.383&step=30&query=sum+by+%28job%29+%28rate%28prometheus_target_scrapes_sample_out_of_order_total%5B1m%5D%29%29&timeout=60s HTTP/1.1" 502 0
2024/04/28 07:02:41 http: proxy error: dial tcp: lookup thanos-querier.openshift-monitoring.svc.cluster.local.9091 on 172.30.0.10:53: no such host