Uploaded image for project: 'Cluster Observability Operator'
  1. Cluster Observability Operator
  2. COO-1306

Visualization is broken in the accelerators common metrics dashboard with NVIDIA GPU

XMLWordPrintable

    • Icon: Bug Bug
    • Resolution: Unresolved
    • Icon: Undefined Undefined
    • None
    • None
    • perses
    • None
    • Quality / Stability / Reliability
    • False
    • Hide

      None

      Show
      None
    • None
    • None
    • None
    • None
    • None
    • None
    • None
    • None

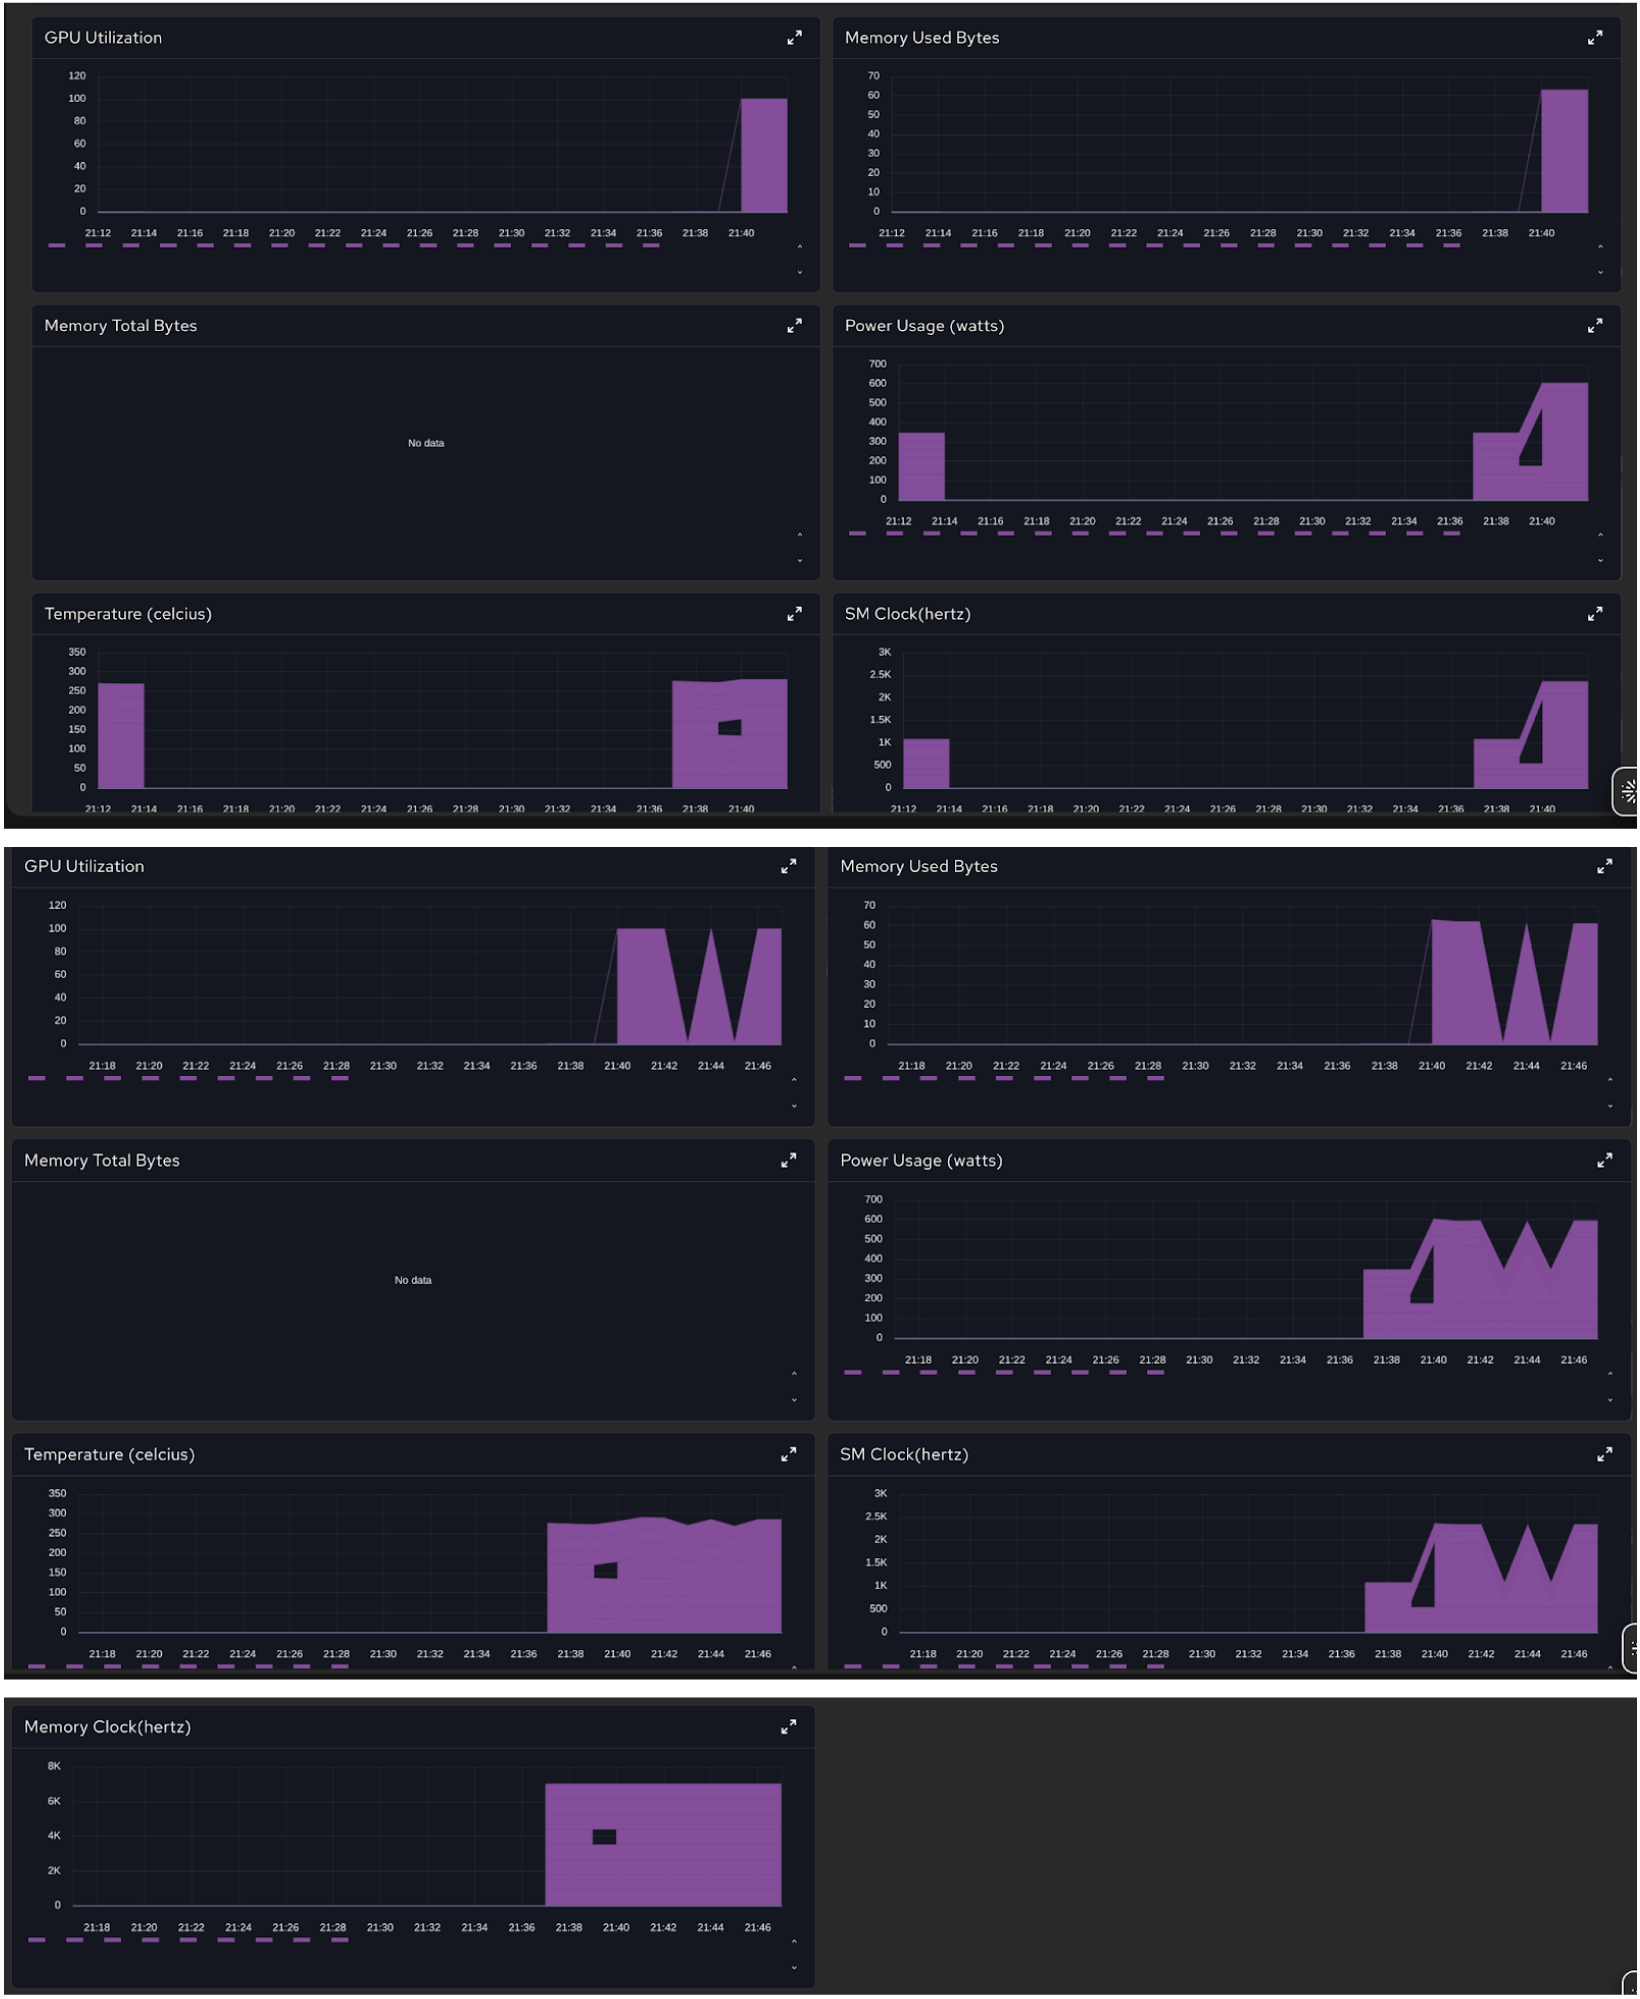
      With a NVIDIA GPU, the visualization looks broken, like a line and an area charts mixed together, and with weird "holes" in the area charts.
      I'm attaching examples.

              gbernal@redhat.com Gabriel Bernal
              rh-ee-vemporop Vitaliy Emporopulo
              None
              None
              None
              None
              None
              Votes:
              0 Vote for this issue
              Watchers:
              3 Start watching this issue

                Created:
                Updated: