-
Bug
-
Resolution: Done
-
 Major
Major
-
4.19
-
Incidents & Support
-
5
-
False
-
-
False
-
CNV v4.19.17.rhel9-9
-
-
Customer Reported
-
None
Description of problem:
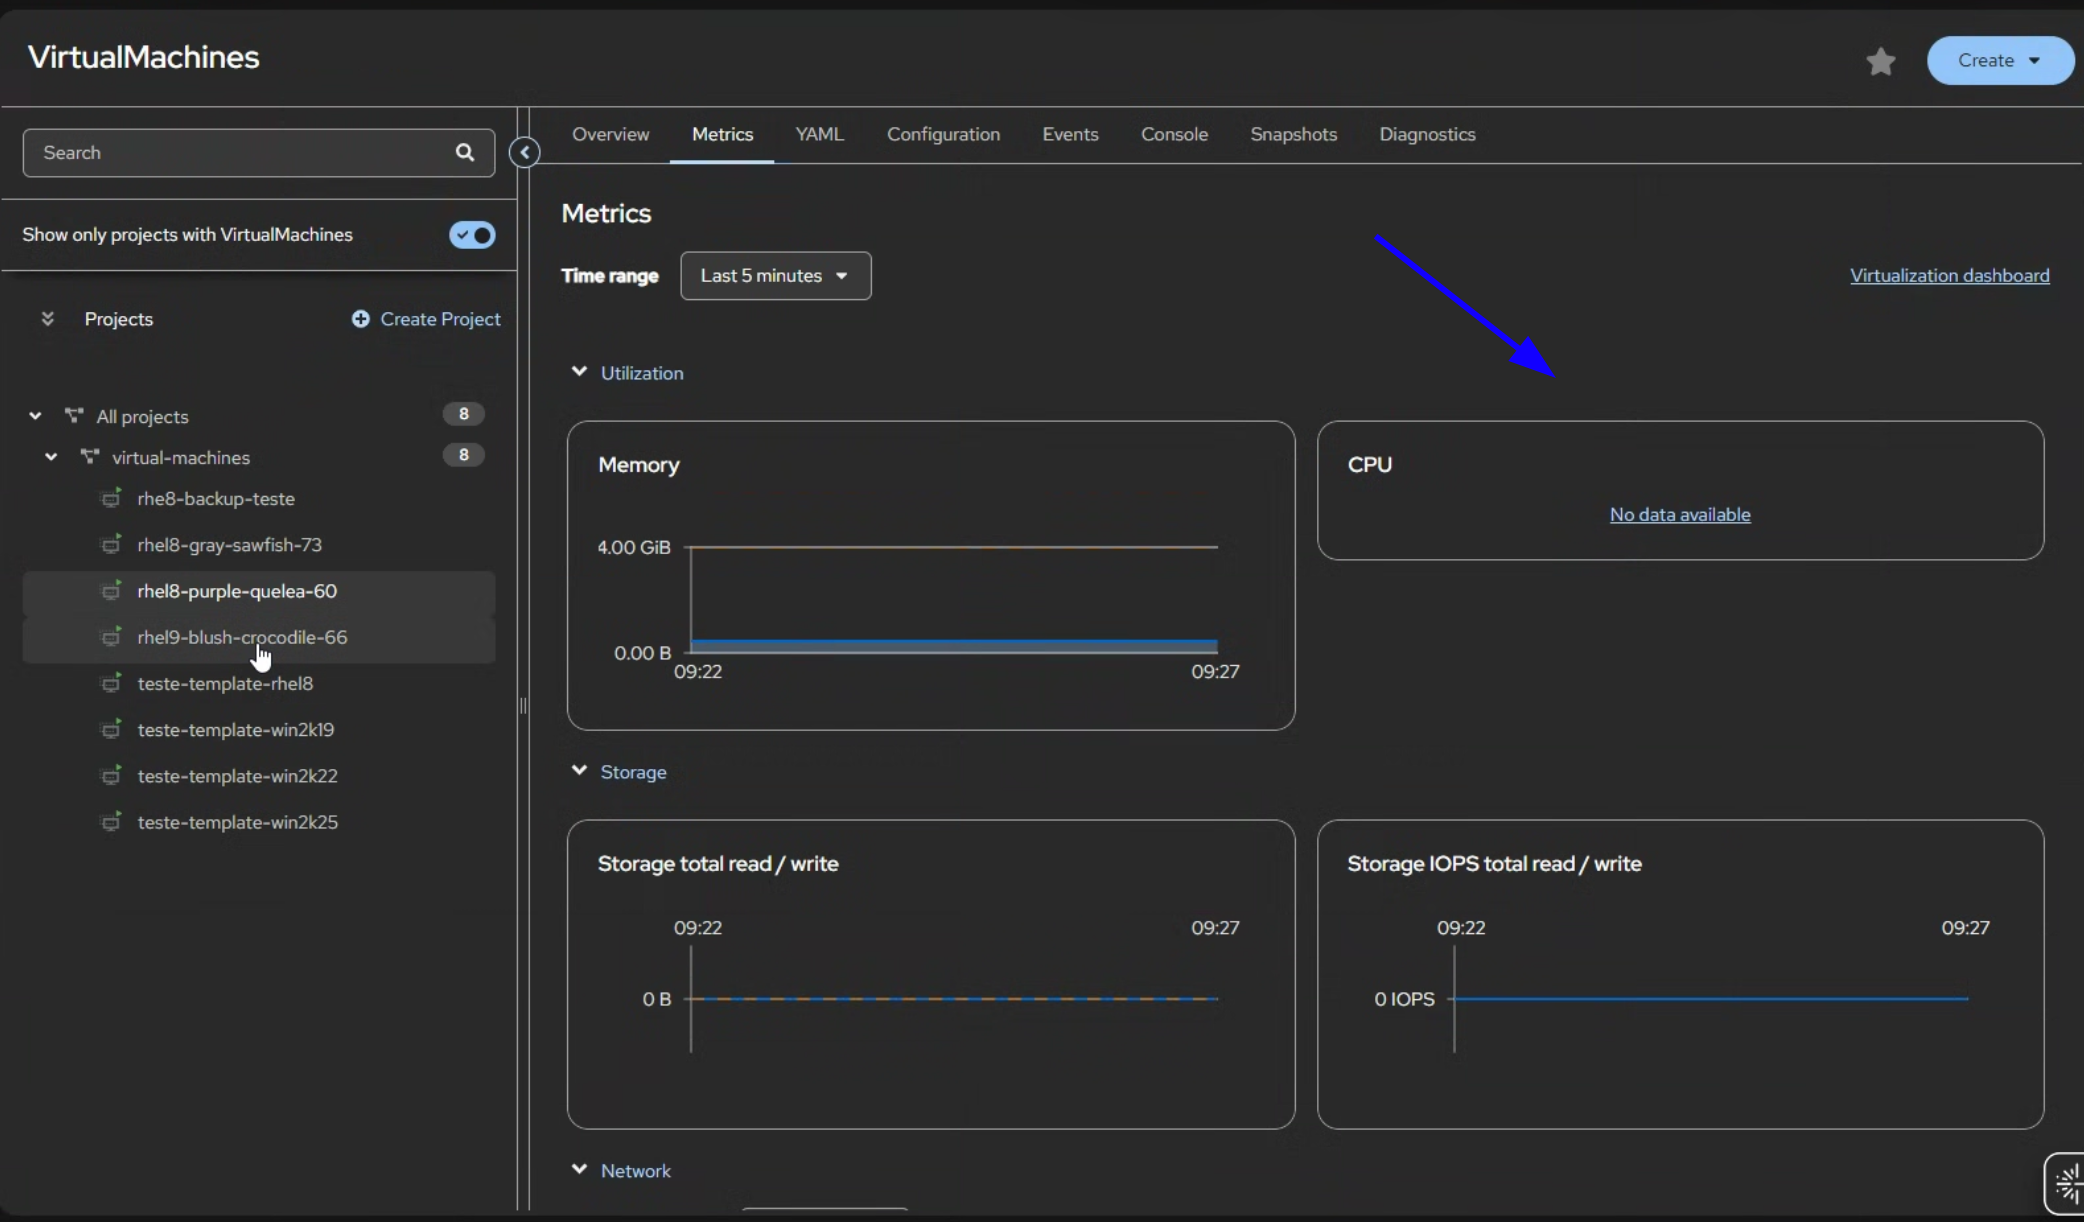
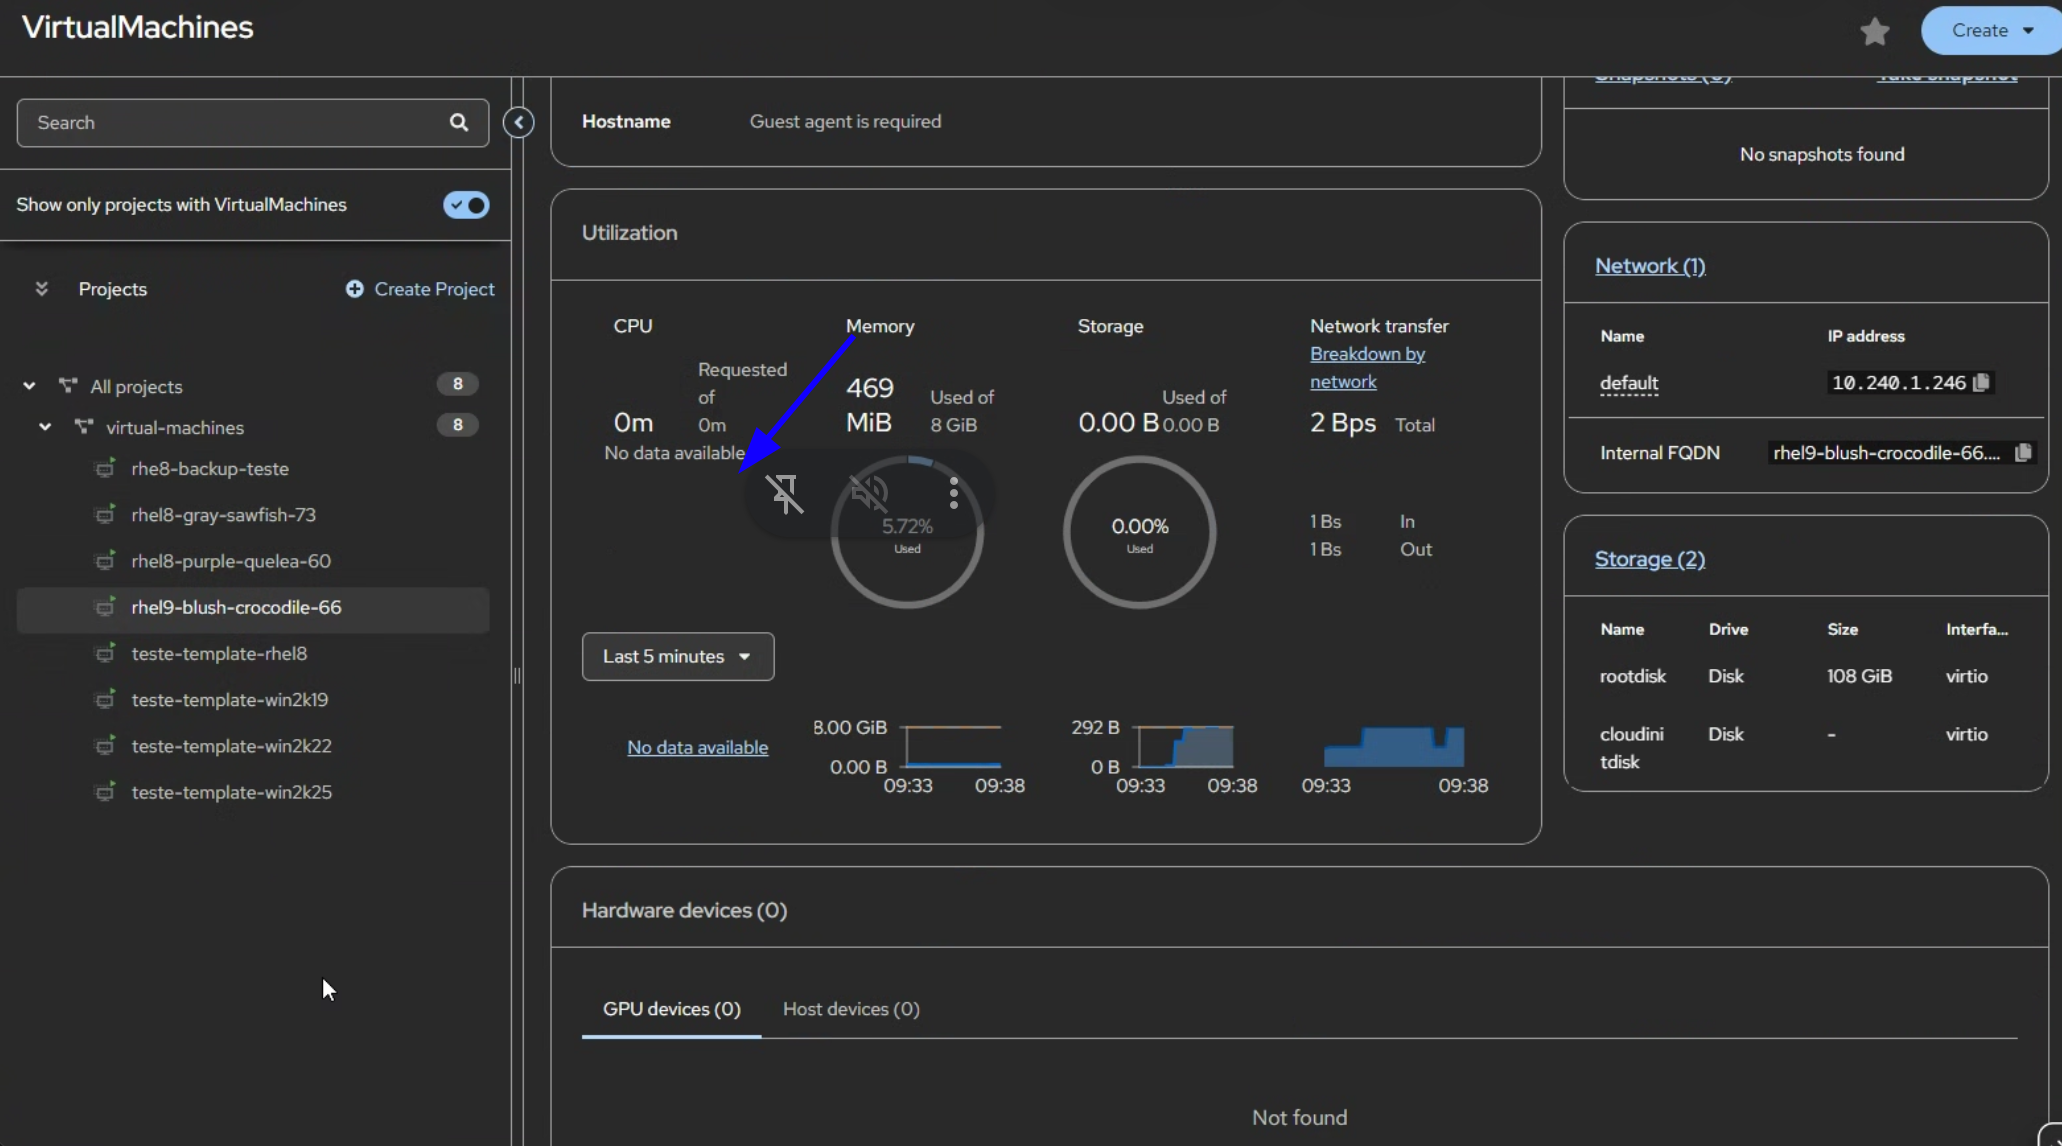
In virtual machine details and metrics CPU usage graph displays 'no data available' even as a cluster-admin, memory and disk is displayed without issues.
When clicking on 'no data available' hyperlink the metrics are visible in Prometheus for all VMs
Version-Release number of selected component (if applicable):
OCP-V 4.19.12
How reproducible:
This affect 2 customer clusters and all VMs
Actual results:
All VMs shows 'no data available'
Expected results:
CPU usage is reported
Additional info:
2 different clusters have the same issue - all the VMs shows No data available for the CPU, just for CPU in Overview -> Utilization -> CPU and also in VM -> Metrics -> CPU
No change when we switch from 5min to different time, if you click on the no data available it will redirect you to the Prometheus metrics that works fine . Also not related to one browser, Edge/Firefox the same

I tried console debug but that shows data from the prometheus
----------
11:24:20.997 XHRGET
https://console-openshift-console.apps.xxx-xxx.xxx.xxx/api/prometheus-tenancy/api/v1/query_range?start=1763561928.697&end=1763562228.697&step=5&namespace=virtual-machines&query=sum(rate(kubevirt_vmi_cpu_usage_seconds_total{name='rhel9-blush-crocodile-66',namespace='virtual-machines'}[5m]))+BY+(name,+namespace)
[HTTP/1.1 200 OK 34ms]

response JSON
status	"success"
data	{ resultType: "matrix", result: (1)[…], analysis: {} }
resultType	"matrix"
result	[ {…} ]
0	{ metric: {…}, values: (61)[…] }
metric	{ name: "rhel9-blush-crocodile-66", namespace: "default" }
values	(61)[ (2)[…], (2)[…], (2)[…], (2)[…], (2)[…], (2)[…], (2)[…], (2)[…], (2)[…], (2)[…], … ]
0	[ 1763587585.437, "0.08154084071418519" ]
1	[ 1763587590.437, "0.08154084071418519" ]
2	[ 1763587595.437, "0.08048148148148156" ]
3	[ 1763587600.437, "0.08048148148148156" ]
4	[ 1763587605.437, "0.08048148148148156" ]
5	[ 1763587610.437, "0.08048148148148156" ]
6	[ 1763587615.437, "0.08118518518518546" ]
7	[ 1763587620.437, "0.08118518518518546" ]
8	[ 1763587625.437, "0.08118518518518546" ]
9	[ 1763587630.437, "0.08118518518518546" ]
10	[ 1763587635.437, "0.08118518518518546" ]
----------

This happens for all the users even for kubeadmin so it should not be something with cluster rights for specific users, i tried the same version in reproducer 4.19.12 but CPU shows metrics for all VMs
- is cloned by
-
-

- MODIFIED
-
- links to
- mentioned on

