-
Epic
-
Resolution: Unresolved
-
 Undefined
-
None
-
None
-
Telemetry Dashboard for SBO
-
False
-
False
-
To Do
-
RHDP-286 - Drive metrics needs to allow us to properly target our workload and developer-focused adoption efforts
-
QE Needed, Docs Needed, TE Needed, Customer Facing
-
42% To Do, 0% In Progress, 58% Done
-
Undefined
Problem
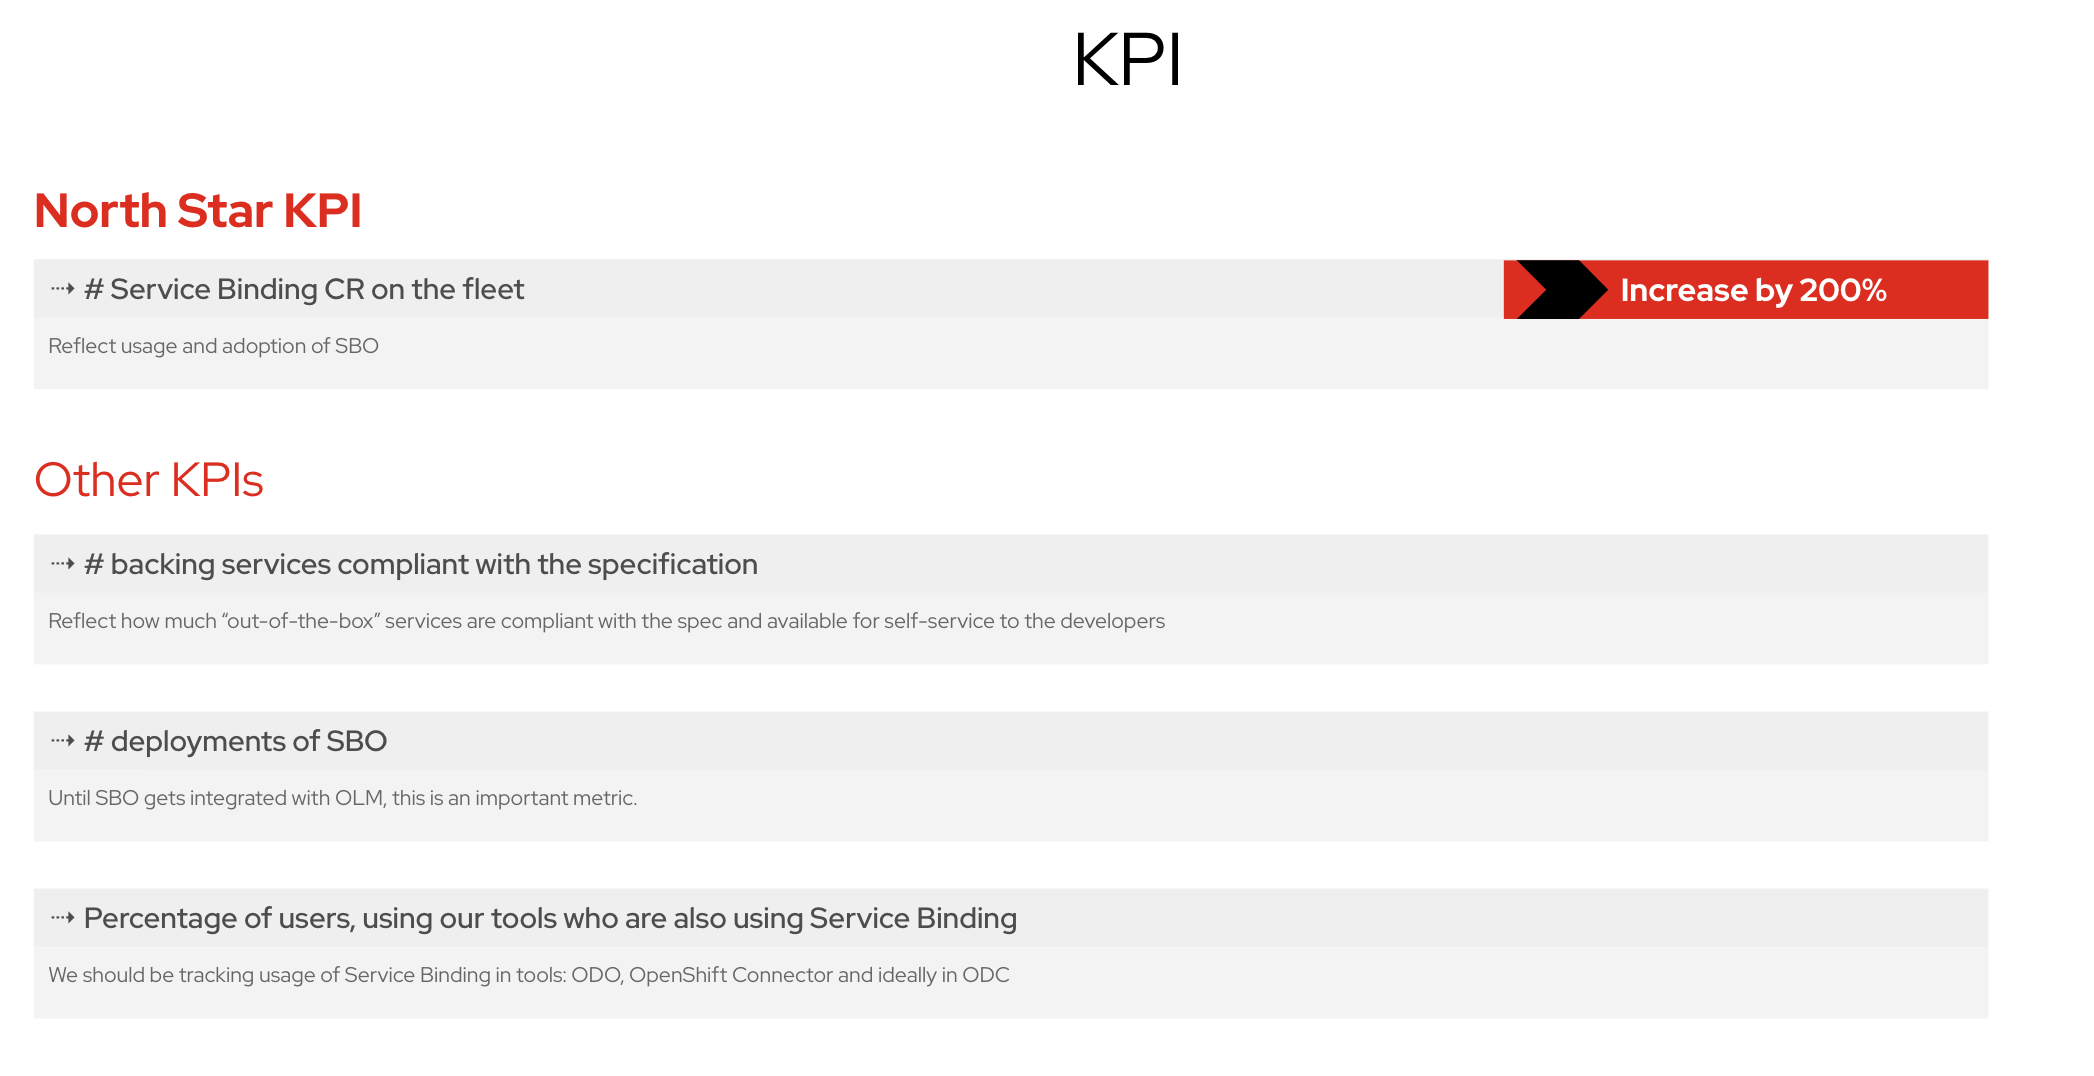
In order to properly measure how SBO is doing, we should create a dashboard that will allow us to follow our progresses.
There is two needs:
- Collecting the proper metrics
- Reporting them in a nice and understandable way
Description
As part of this epic, we would like to focus on making sure we are able to report certain usage metrics.

Being able to capture what the backing services are, would also be helpful.
We would then look at how we can automated pulling the data from different sources and publish them in a spreadsheet dedicated to SBO team.
Ideally, we would also like to pull data that are a little bit more technical - showing the health of the tool and showing how it is performing:
- Time between the creation of the Service Binding CR and it's "pick up" by SBO
- Time from picking up the CR and actually "doing" the binding
- Memory usage and CPU usage
Acceptance Criteria
- Telemetry in place allowing us to collect the data for our KPIs
- Script pulling the data and publishing them in a spreadsheet
- Dashboard showing in an handy way the data.
Telemetry slides: https://docs.google.com/presentation/d/1-pu7BCkD4ELKYEIhcuVQ4v0Op30-J6tL-RW2otXi3HU/edit#slide=id.p
Design Notes:
To be able to accomplish this we need to make sure that the OpenShift fleet has the metrics we need with the dimensions we need. We already have CR being a metric that we can count and filter based on whether if of type ServiceBinding. We also can do some joins to be able to filter by internal/external and version. However, if we had our own separate metric with our own dimensions then it will more flexible and faster to get the data and update dashboards. So I will suggest with define our own metrics as follow:
SERVICE_BINDING_INSTANCE_COUNT with dimensions (version, api_version, cluster_id, service_type, workload_type)
With this metric we will able to do a few queries to get the following:
- Service Binding Resources SUM filtered by version and cluster location
- List of all Bound Service Types
- Count of each category of Bound Service Types
- List of all the Bound Workload Types
- Count of each category of Bound Workload Types
- blocks
-
-
- Closed
-
- duplicates
-
-
- Closed
-