-
Sub-task
-
Resolution: Done
-
 Normal
-
None
-
None
-
None
-
False
-
-
False
-
None
-
None
-
None
-
None
-
None
-
None
Description of problem:
In OCP 4.14, we are observing an excessive rate of terminated watchers on node resources only.

It is our suspicion that this is related to increased CPU activity on both kube-apiserver and all client components that use node watchers, including: machine-config-daemon, ovnkube-node, and kube-apiserver pods (in decreasing order).
Version-Release number of selected component (if applicable):
4.14.0-0.nightly-2023-08-08-222204
Note: This nightly was specifically chosen to isolate changes from 4.13 to 4.14 without the introduction of ovn-ic in current 4.14 nightlies.
How reproducible:
100%
I first observed this in 120 and 250 node clusters, but as of today, I have seen it in a 24 node cluster as well.
Steps to Reproduce:
1. Create a 4.14 cluster.
2. Scale to 120 workers
3. Run `kube-burner ocp node-density-cni --log-level=info --qps=35 --burst=35 --gc=true --es-index=ripsaw-kube-burner --pods-per-node=50`
Actual results:
Observe the kube-apiserver has high rate of the following log message:
cache_watcher.go:180] Forcing nodes watcher close due to unresponsiveness: key: "/minions", labels: "", fields: "". len(c.input) = 10, len(c.result) = 1
Observe ovnkube-node has high rate of watchers being closed:
reflector.go:788] k8s.io/client-go/informers/factory.go:150: Watch close - *v1.Node total 746 items received
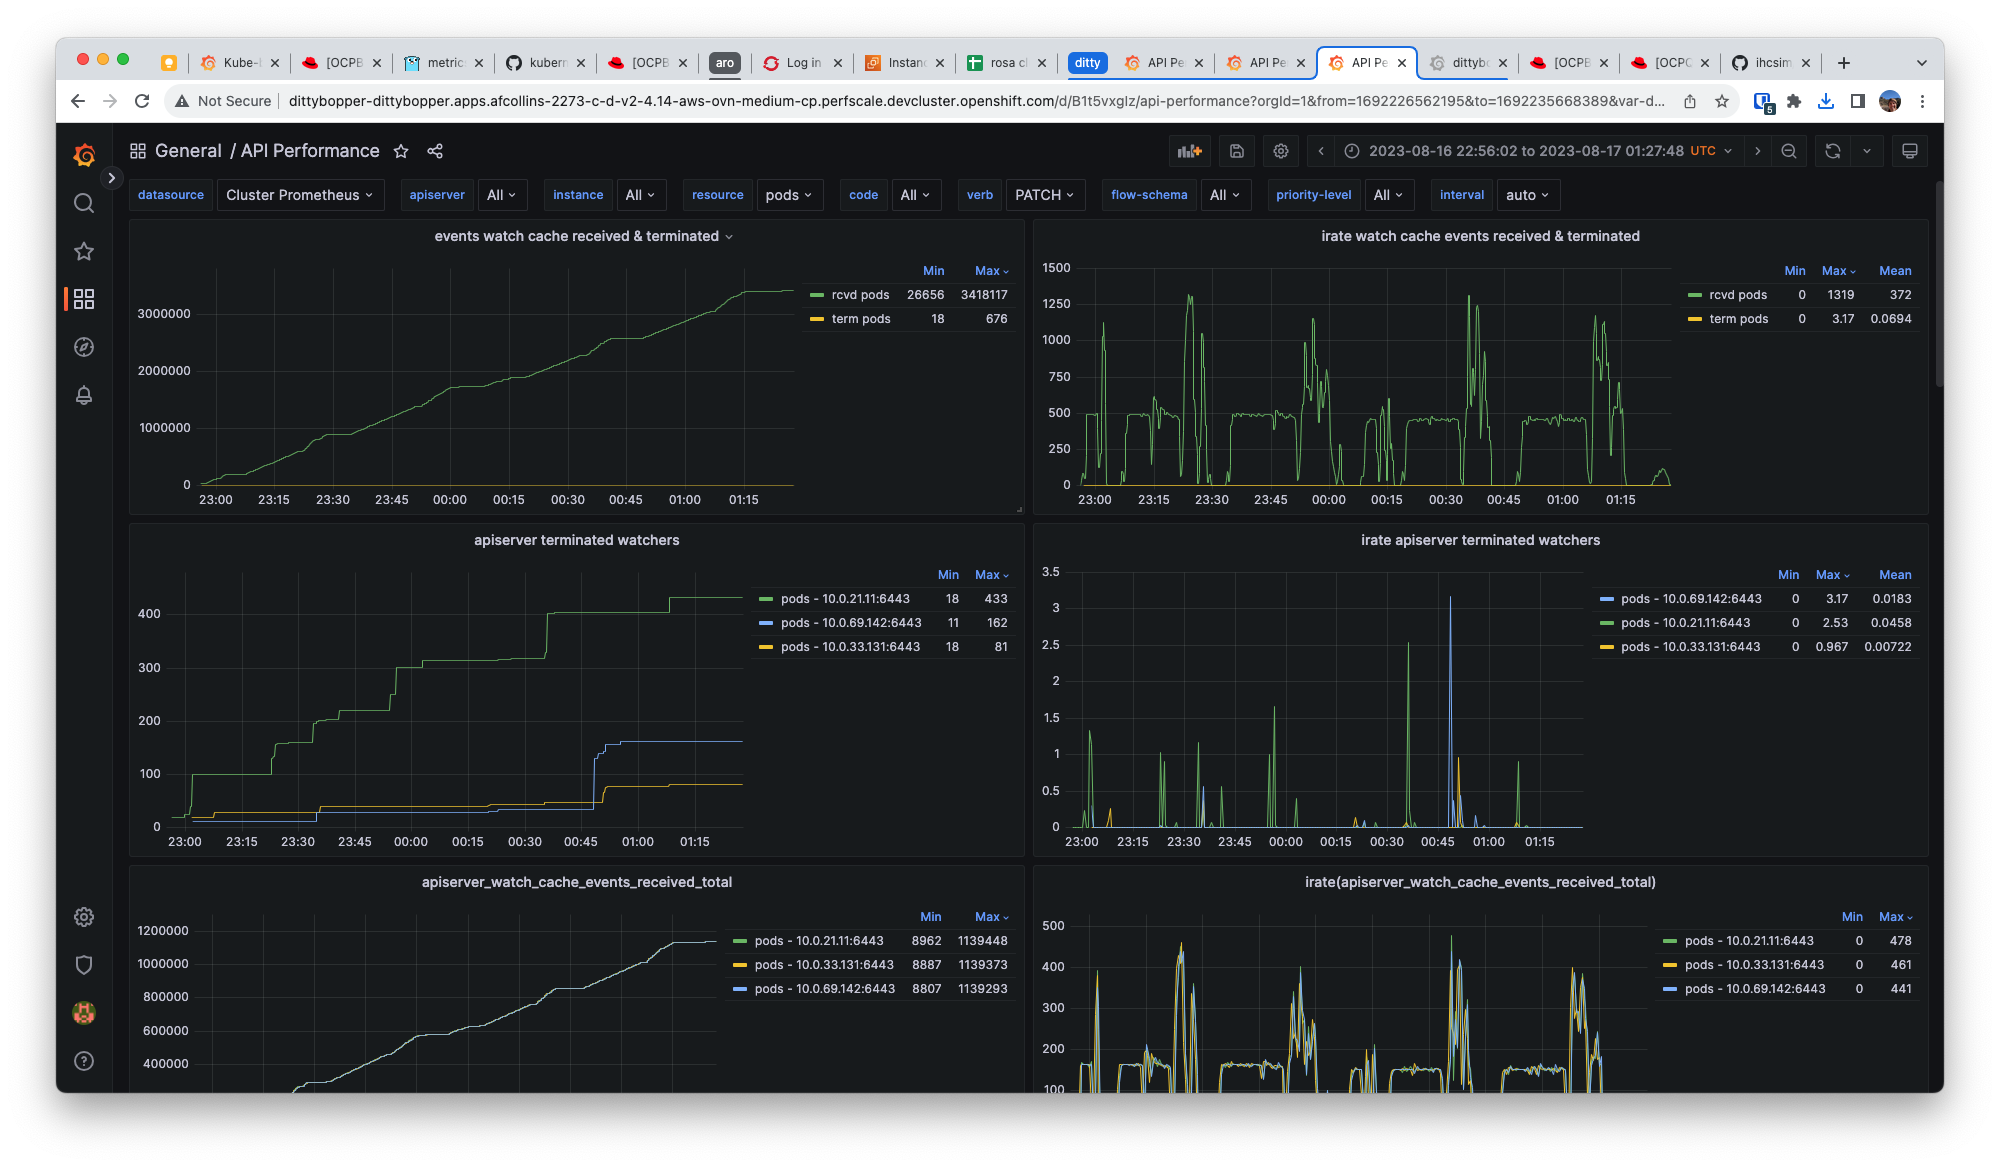
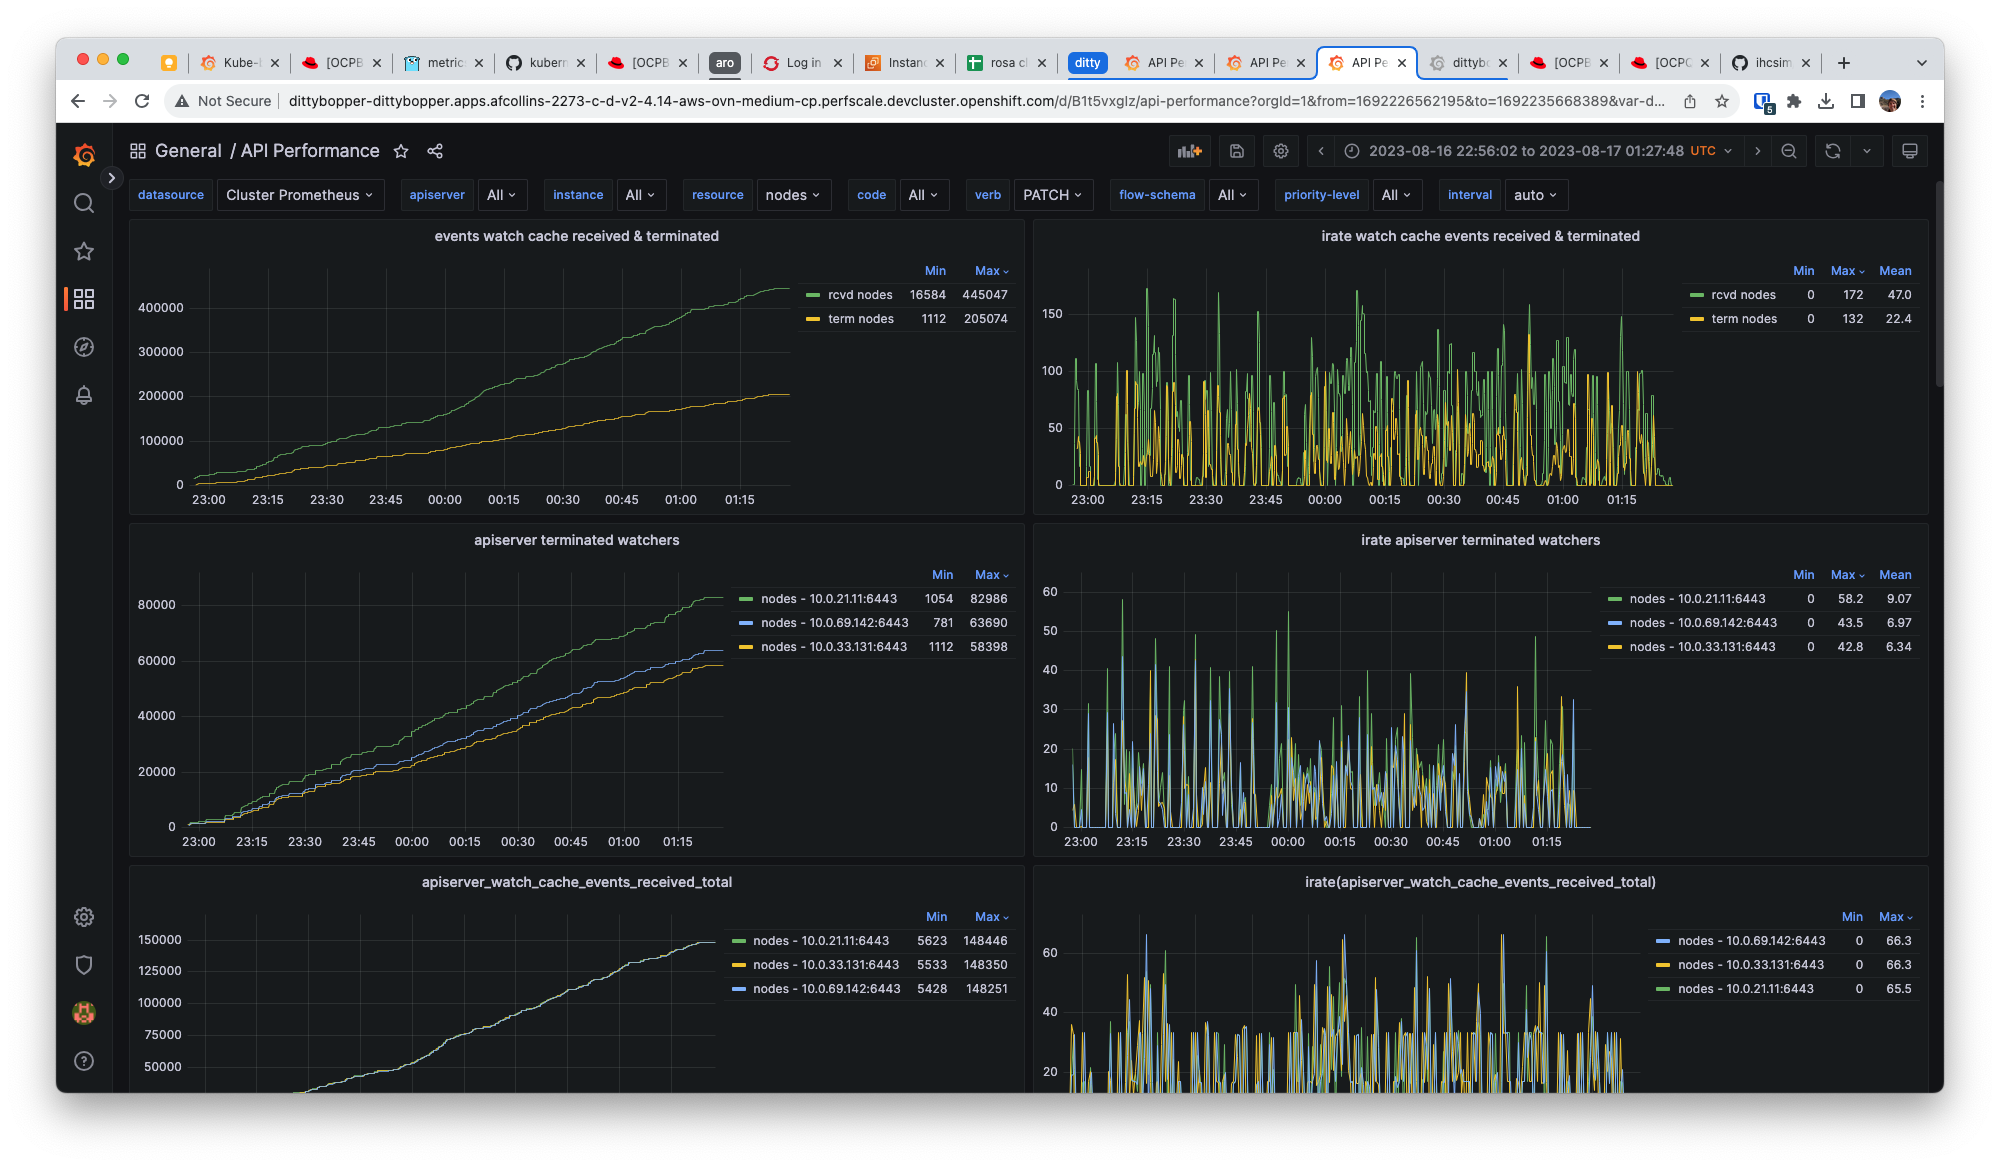
Observe similar rates of watch events and terminated watchers for node resources using prometheus metrics:
watch events: sum( irate( apiserver_watch_cache_events_received_total{resource=~"nodes"}[2m] ) ) by (resource)
terminated watchers: sum( irate( apiserver_terminated_watchers_total{resource=~"nodes"}[2m] ) ) by (resource)
We observe average(events_received)=155 and average(terminated_watchers)=99.7
Expected results:
Terminated watchers for node resources are far less frequent, like what we see with pods, which have average((events_received))=1300 and average(rate(terminated_watchers))=3.17
Additional info:
After some collaboration with Lukasz, I understand there is a cache size that can be increased at the expense of memory.
Since we have plenty of memory (30GiB used of 120GiB) and we are running out of 16 cores of CPU, I think this is a valid time to consider increasing that cache size.
https://github.com/kubernetes/kubernetes/blob/master/staging/src/k8s.io/apiserver/pkg/storage/cacher/watch_cache.go#L657

There are components where we see an increase in PATCH nodes requests leading to update in WATCH requests and those will be addressed in other bugs.
- is caused by
-
OCPBUGS-18097 OCP 4.14 increased rate of patch nodes requests from node SAs
-

- Closed
-
- is related to
-
-
- Closed
-
- relates to
-
-

- Closed
-