-
Sub-task
-
Resolution: Unresolved
-
 Undefined
-
None
-
None
-
None
-
None
-
False
-
None
-
False
-
None
-
None
-
None
-
None
-
None
-
None
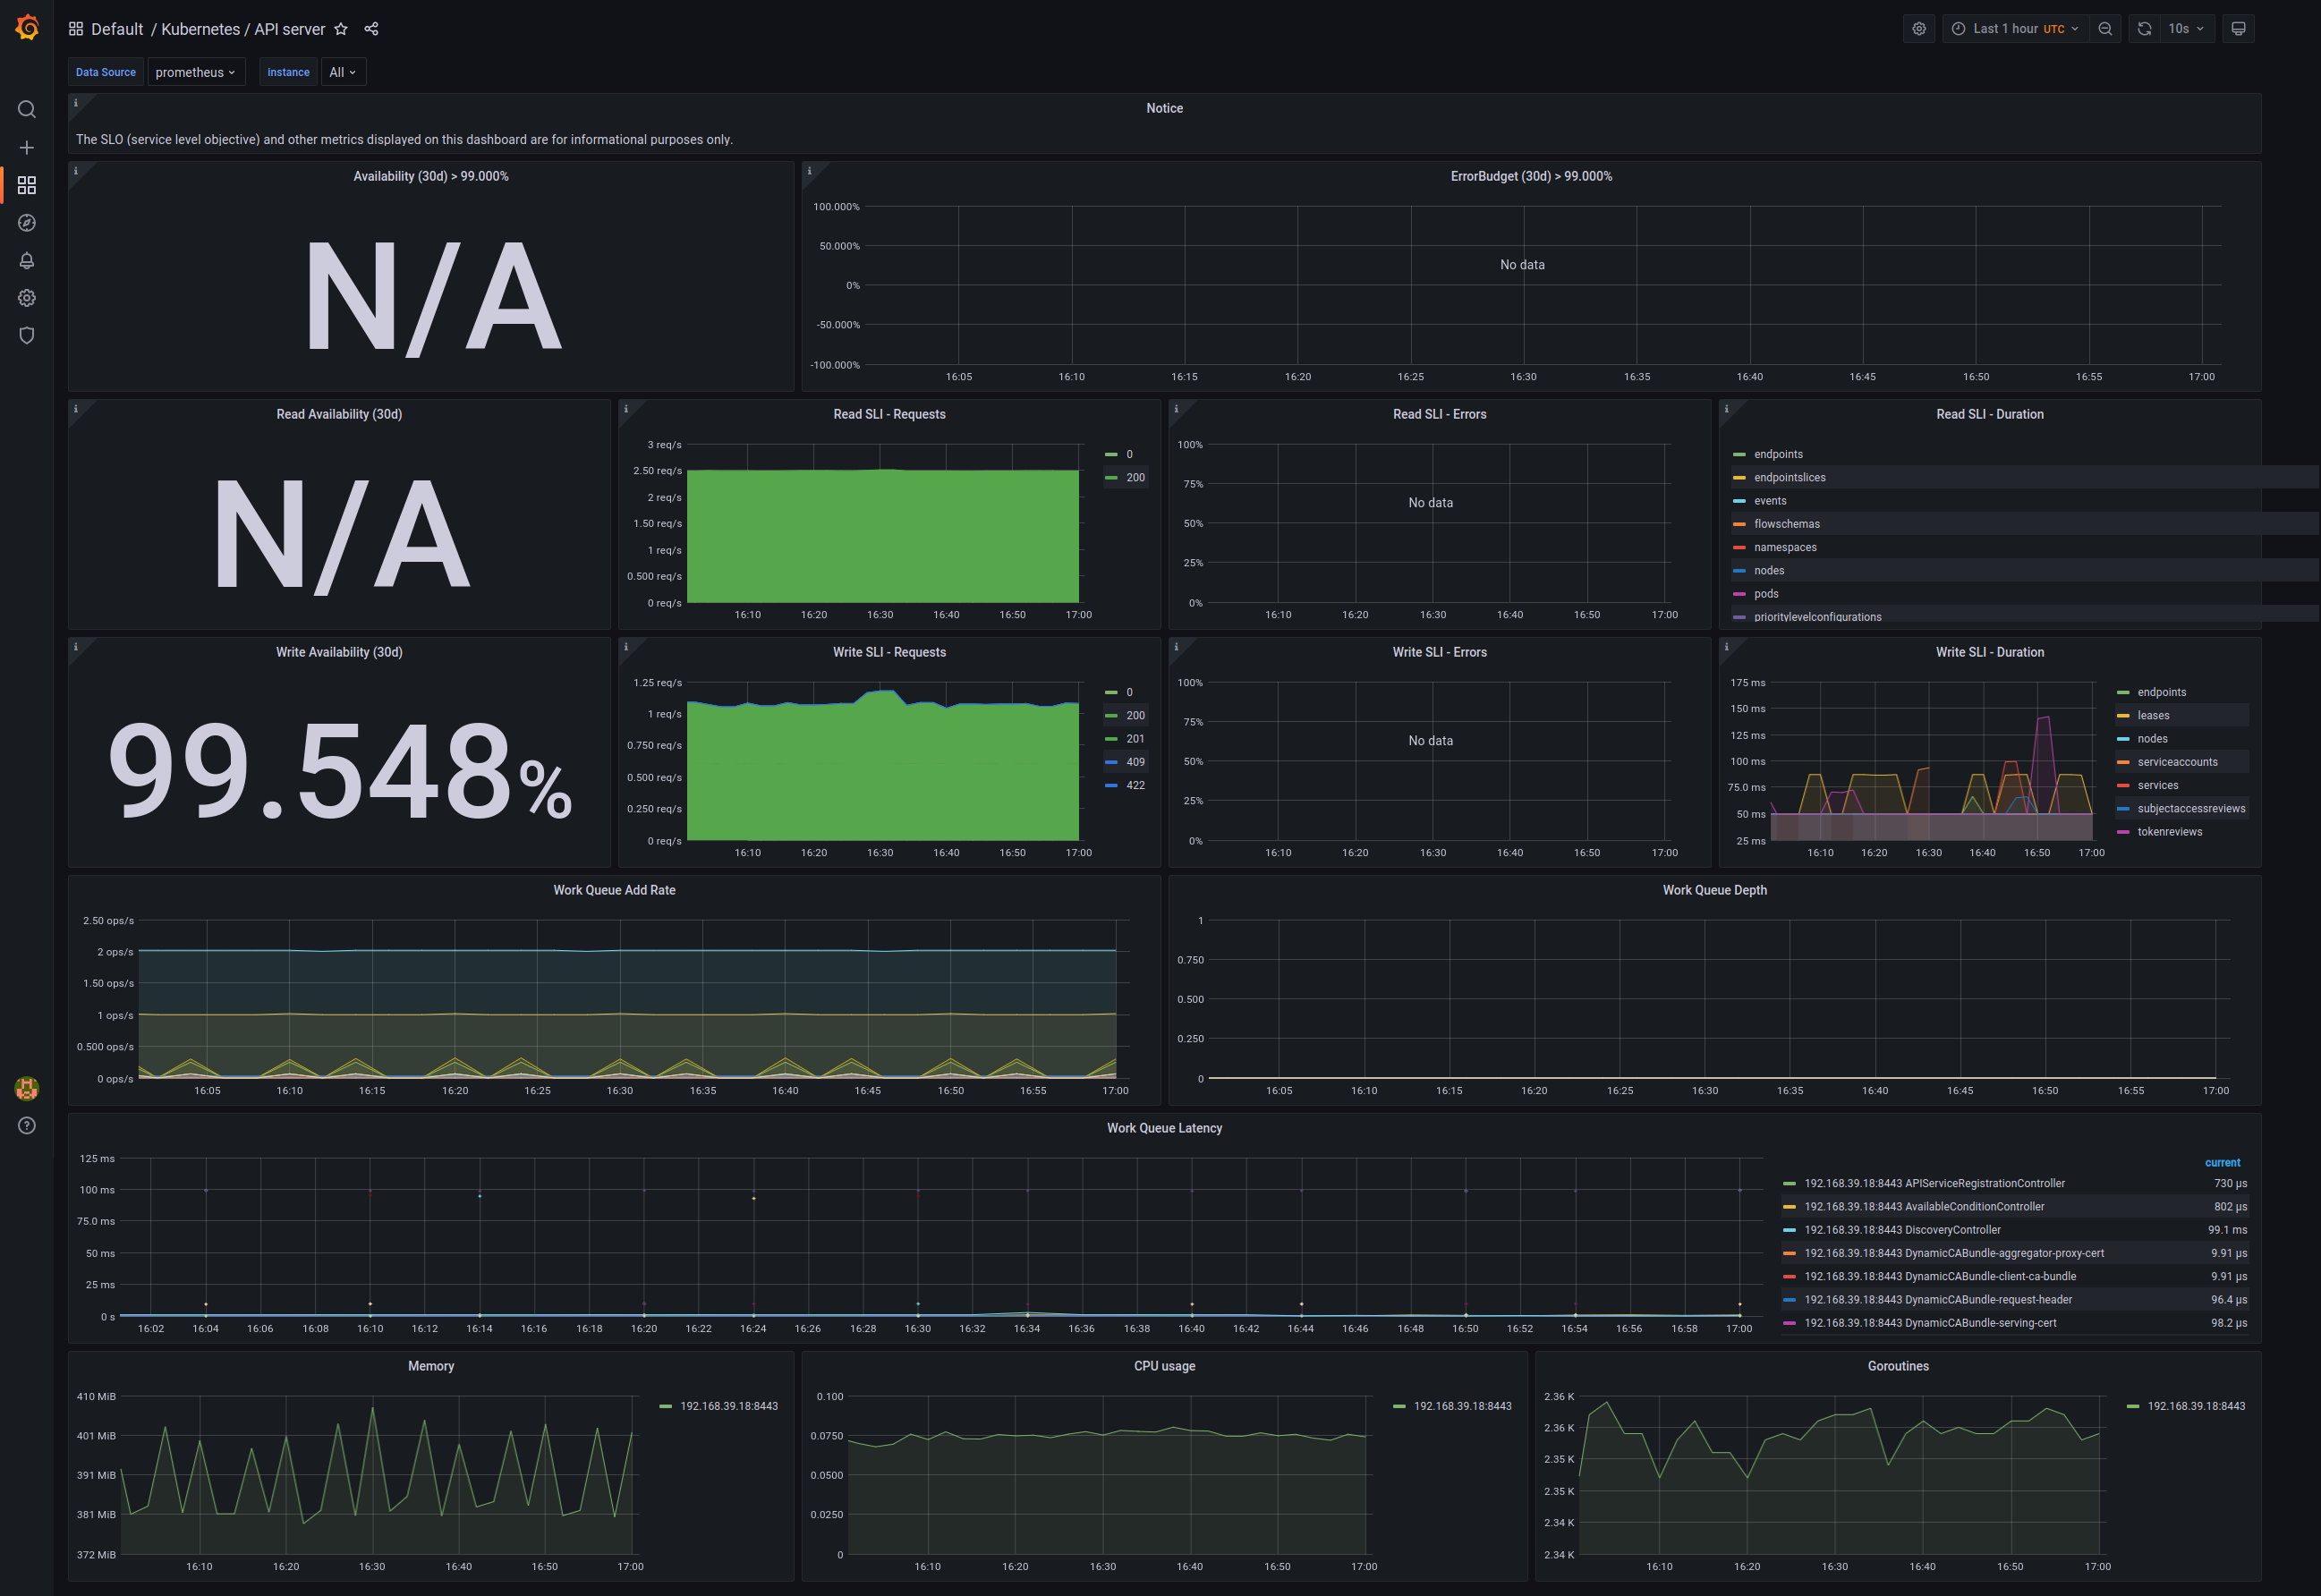
Currently, when debugging network issues in OpenShift it is pretty hard to narrow down the cause of the problem. Whilst we will be adding alerts to better detect symptoms that could be caused by network issues, further investigation will still be required. Since we already know what are the key information that may be helpful to a cluster admin, it would be great to regroup them in a dashboard for client metrics.
Essentially what we want is to create a dashboard similar to Default / Kubernetes / API Server but based on client-go metrics.

Going from top to bottom the new dashboard should:
- not have availability and budget burn panels until we have figured out thresholds and SLO targets
- have 3 rows with request rate, error rate, and 99th percentile of latency for:
- direct connections
- internal load balancer
- services
- add a new panel for request sizes based on https://github.com/kubernetes/kubernetes/pull/106911
- add a new panel for retry rate per host based on https://github.com/kubernetes/kubernetes/pull/108396
- have the same workqueue related panels but for job != apiserver
- not have resource usage related dashboards since it won't be very useful here